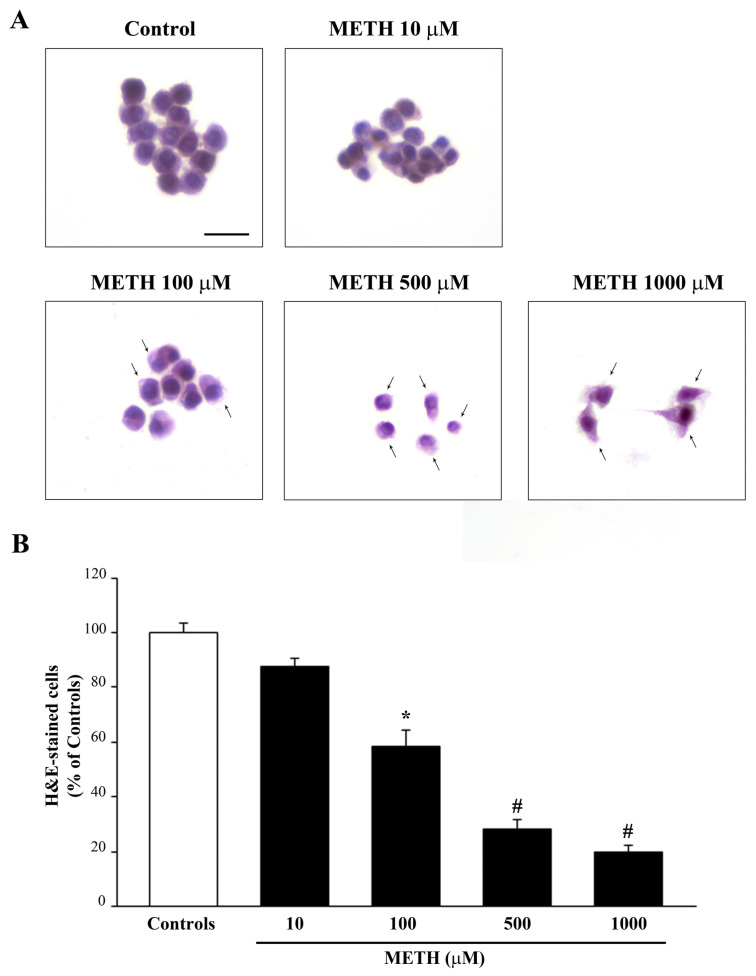
Figure 1.
METH dose-dependently induces cell death. (A) Representative pictures of H&E-stained cells show that increasing doses of METH (from 10 μM up to 1000 μM) dose-dependently induces cell loss and morphological changes in spared cells (arrows). (B) The graph reports the percentage of cells counted after METH treatment (at doses ranging from 10 μM up to 1000 μM) compared with those counted in control conditions. Values are given as the mean percentage ± S.E.M. of cells counted from three independent experiments (assuming controls as 100%). * p ≤ 0.05 compared with controls; # p ≤ 0.05 compared with controls and METH 100 μM. Scale bar = 14 μm.

