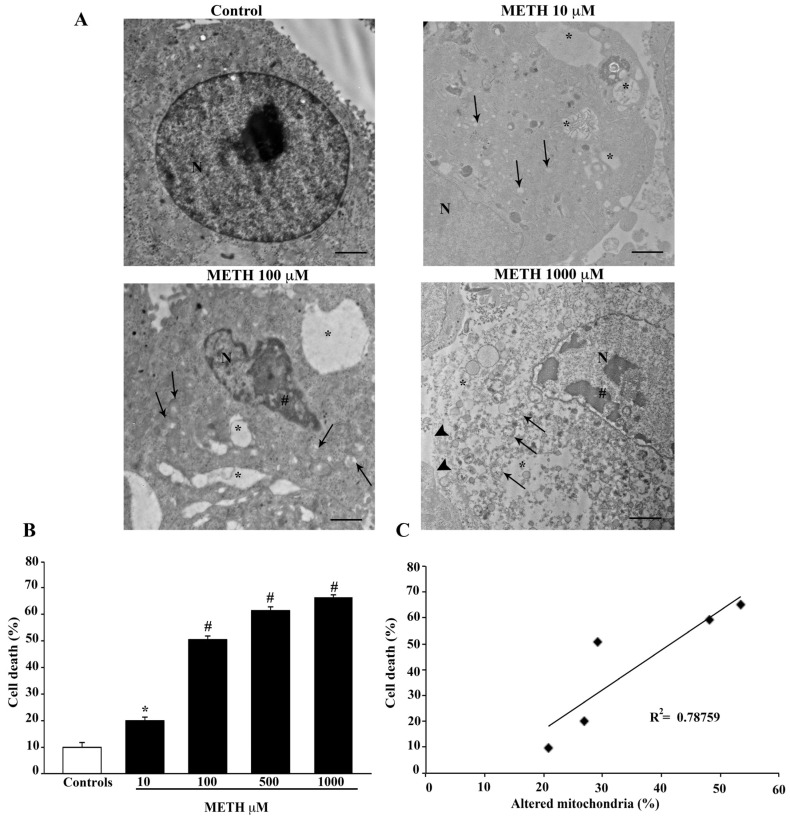
Figure 5.
METH-induced cell death correlates with mitochondrial alterations. (A) Representative TEM micrographs showing healthy (Control) and damaged cells following increasing doses (10 μM, 100 μM, 1000 μM) of METH. After METH treatment, nuclear condensation (#), large cytosolic vacuoles (*), altered mitochondria (arrows) and fragmentation of plasma membrane (arrowheads) are shown. (B) The graph reports the percentage of METH-induced cell death. (C) The graph reports the linear regression between the percentage of cell death and the percentage of altered mitochondria following increasing doses of METH (p = 0.04). Values are given as the mean percentage ± S.E.M. from N = 100 cells. * p ≤ 0.05 compared with controls; # p ≤ 0.05 compared with controls and METH 10 μM. Scale bars = 700 nm. N = nucleus.

