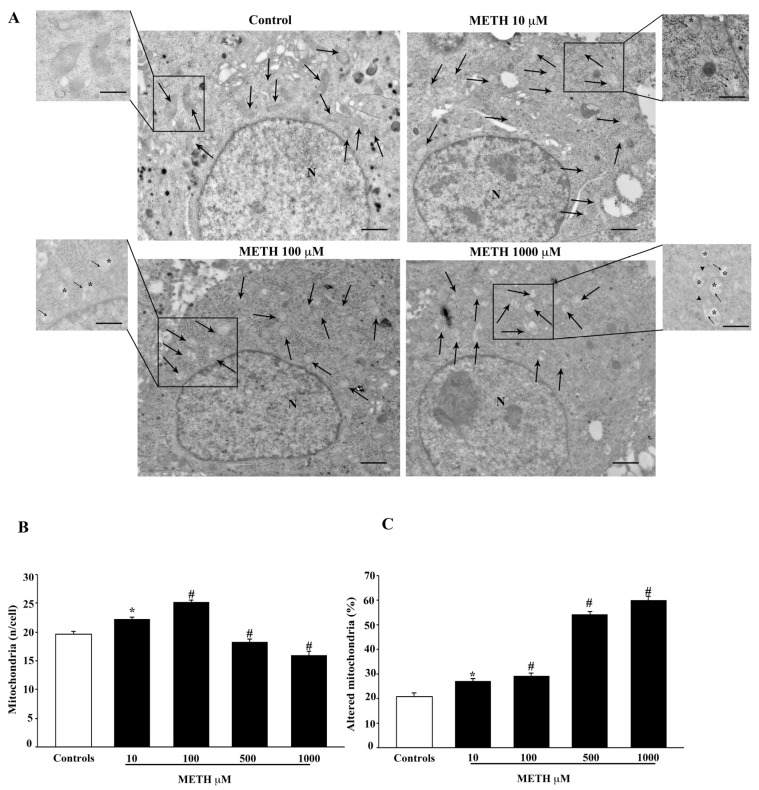
Figure 6.
METH produces dose-dependent mitochondrial alterations. (A) Representative TEM micrographs showing mitochondria (arrows) in control and after increasing doses of METH. Inserts at high magnification show details of mitochondrial ultrastructure for each experimental group, such as matrix dilution (*), broken crests (arrows) and ruptures of membranes (arrowheads). (B) The graph reports the total number of mitochondria after increasing doses of METH (from 10 μM up to 1000 μM). (C) The graph reports the dose-dependent increase in altered mitochondria following METH. Values are given either as the mean ± S.E.M (B) or as the mean percentage ± S.E.M. (C) from N = 50 cells per group. * p ≤ 0.05 compared with controls; # p ≤ 0.05 compared with controls and METH 10 μM. Scale bars = 500 nm; 280 nm (inserts).

