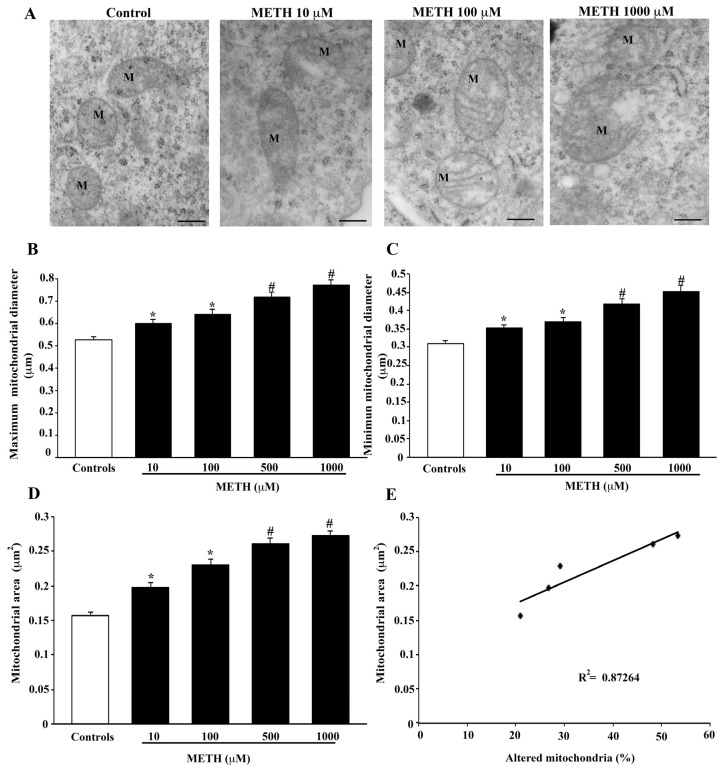
Figure 7.
METH modifies mitochondrial size. (A) Representative TEM micrographs showing dose-dependent mitochondrial (M) changes induced by METH. Graphs report the maximum (B), and the minimum (C) mitochondrial diameter and the mitochondrial area (D). The graph reports the linear regression (E) between the mitochondrial area and the percentage of altered mitochondria for various doses of METH (p = 0.02). Values are given as the mean ± S.E.M from N = 150 mitochondria per group. * p ≤ 0.05 compared with controls; # p ≤ 0.05 compared with controls and METH 10 μM and 100 μM. Scale bars = 160 nm.

