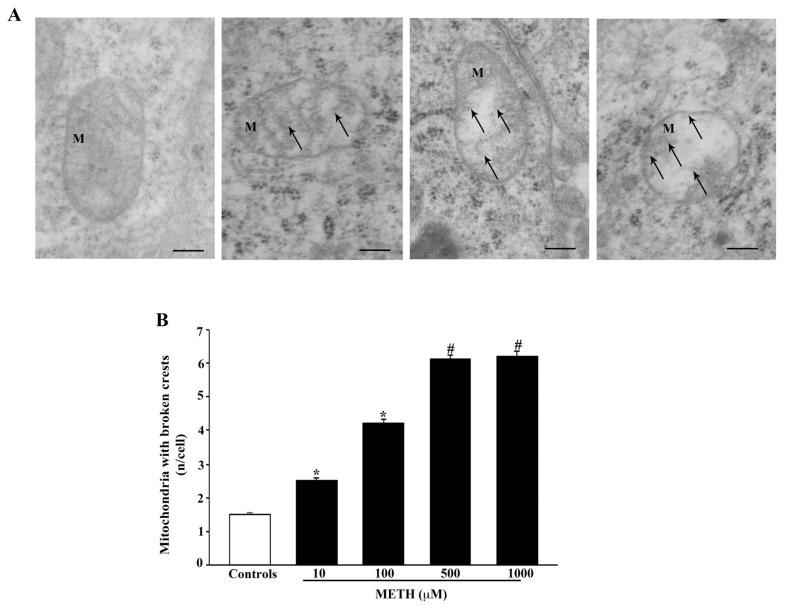
Figure 9.
METH breaks mitochondrial crests. (A) Representative TEM micrographs showing that METH dose-dependently increases mitochondria (M) with broken crests (arrow). (B) The graph reports mitochondria with broken crests. Values are given as the mean ± S.E.M from N = 50 cells per group. * p ≤ 0.05 compared with controls; # p ≤ 0.05 compared with controls and METH 10 μM and 100 μM. Arrows point to broken crests. Scale bars = 160 nm.

