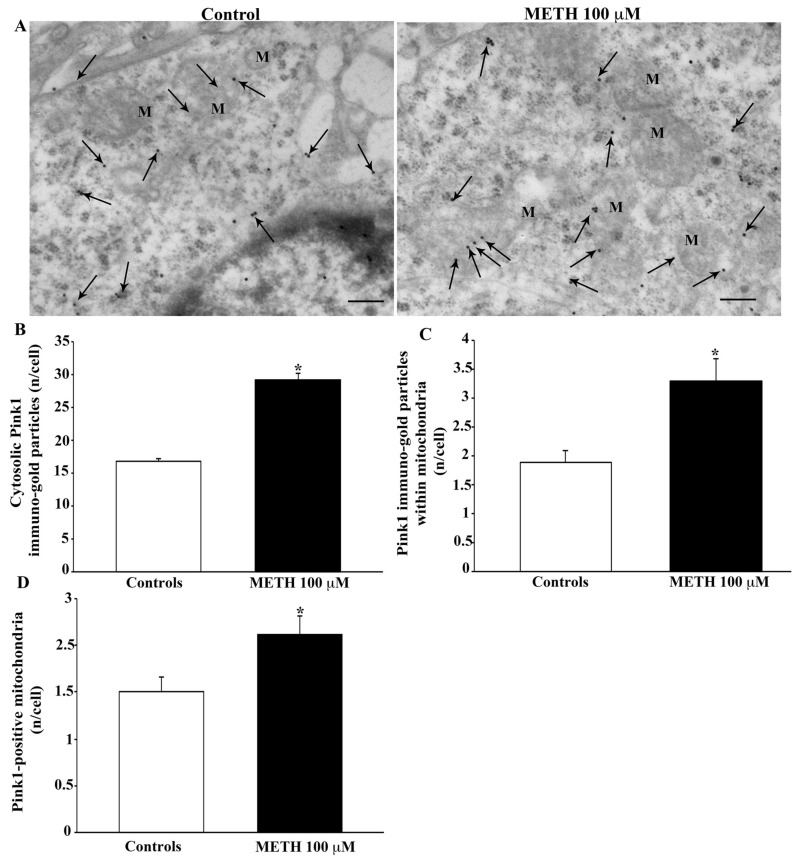
Figure 15.
METH increases the protein, Pink1. (A) Representative TEM micrographs showing Pink1 particles from control and following METH 100 μM. Arrows point to Pink1 immunogold particles within cytosol and mitochondria (M). Graph (B) reports the number of Pink1 immunogold particles within the cytosol. Graph (C) reports the number of Pink1 immunogold particles within mitochondria. Graph (D) indicates the number of Pink1-positive mitochondria. Values are given as the mean ± S.E.M from N = 50 cells per group. * p ≤ 0.05 compared with controls. Scale bars = 170 μm.

