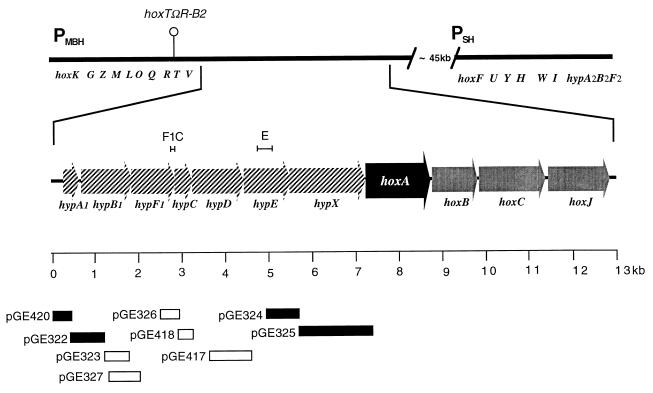
FIG. 1.
The A. eutrophus hydrogenase genes. The upper part of the diagram represents the two hydrogenase gene clusters on the A. eutrophus megaplasmid pHG1. The genes of the MBH region (hoxKGZMLOQRTV) and SH region (hoxFUYHWIhypA2B2F2) are labeled below the bar. The promoters PMBH and PSH are indicated. The site of an interposon in the polar mutation in strain H16 hoxTΩR-B2 is marked by a hairpin. The segment containing the regulatory genes hoxA, hoxB, hoxC, and hoxJ and the upstream hyp genes (hatched arrows) is enlarged. The scale bar pertains to the enlarged part of the drawing. The inserts of the various promoter test constructs are represented by bars. Open bars represent plasmids testing negative on X-Gal indicator plates; solid bars denote positive constructs. The brackets above the genetic map indicate the sequences used to generate the riboprobes F1C and E.

