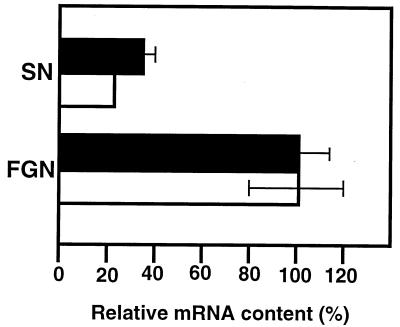
FIG. 4.
Relative abundance of A. eutrophus hyp mRNA in repressed and derepressed cells. Total RNA was isolated from A. eutrophus cells grown to mid-log phase on SN or FGN medium; 5 to 20 μg of each sample was hybridized to 32P-labeled riboprobe (105 to 106 cpm) for 8 h at 45°C. Following RNase treatment, the protected hybrids were separated in 6% sequencing gels. Labeled species were quantitated by densitometric analysis of scanned images. The bars (solid, probe E; open, probe F1C) represent radioactivities of protected fragments, taking the value for the FGN culture as 100% in each case. Each bar represents the average of determinations done on three separate cultures. Standard errors are indicated by brackets (in one case the standard error was too small for graphic representation).

