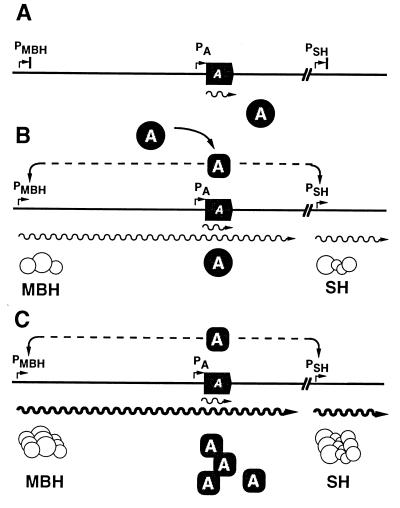
FIG. 6.
Molecular model for the derepression of the hox regulon. The schematic shows a simplified map of the hox gene clusters, with the hoxA gene represented by a solid arrow. Gene products are represented as circles; transcripts are represented as wavy lines. The activated form of HoxA is symbolized as an oval. See text for details.

