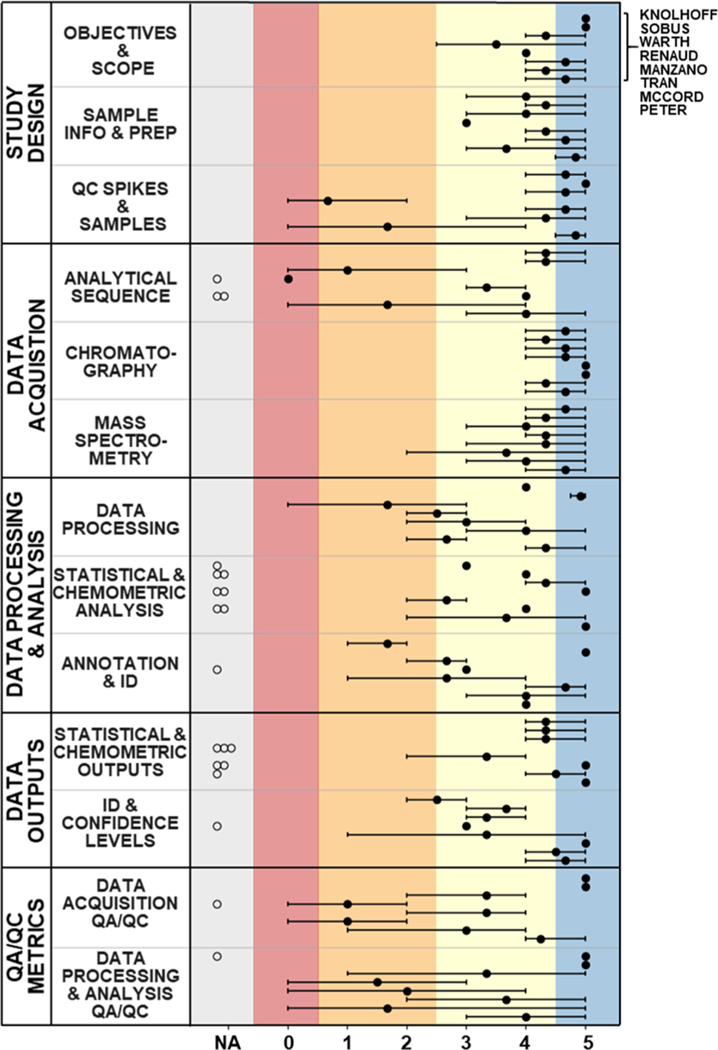
Figure 3.
V3 scoring results of external reviewer evaluations for all articles, grouped by SRT sub-category. All article scores are in the same order (from top to bottom, as noted at the figure top right) in each sub-category, and are grouped according to study type [NTA Performance—Knolhoff et al. and Sobus et al.;30,31 NTA Method Development—Warth et al. and Renaud et al.;28,32 NTA Application—Manzano et al. and Tran et al. (GC × GC-TOFMS),27,33 McCord et al. and Peter et al. (LC-HRMS)].29,34 Filled dots represent average reviewer scores, error bars represent reviewer score ranges, and open circles are shown for NA scores. Coloration was applied after the evaluation process (i.e., reviewers did not assign numeric scores with paired colors) by mapping the 6-level V3 scores onto the final 5-level color scheme.

