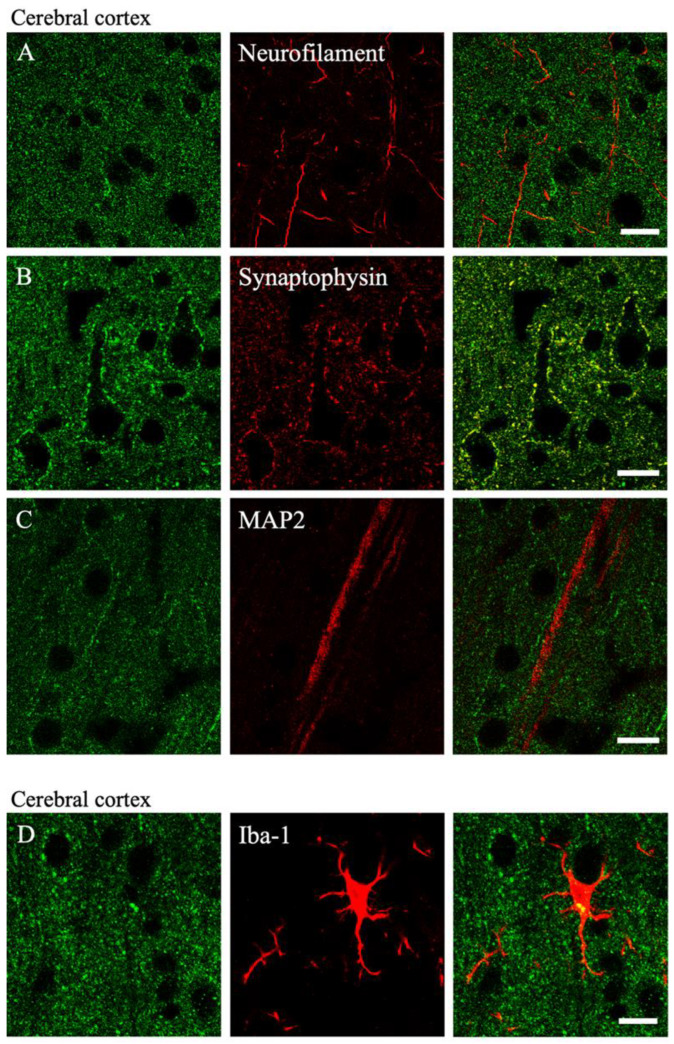
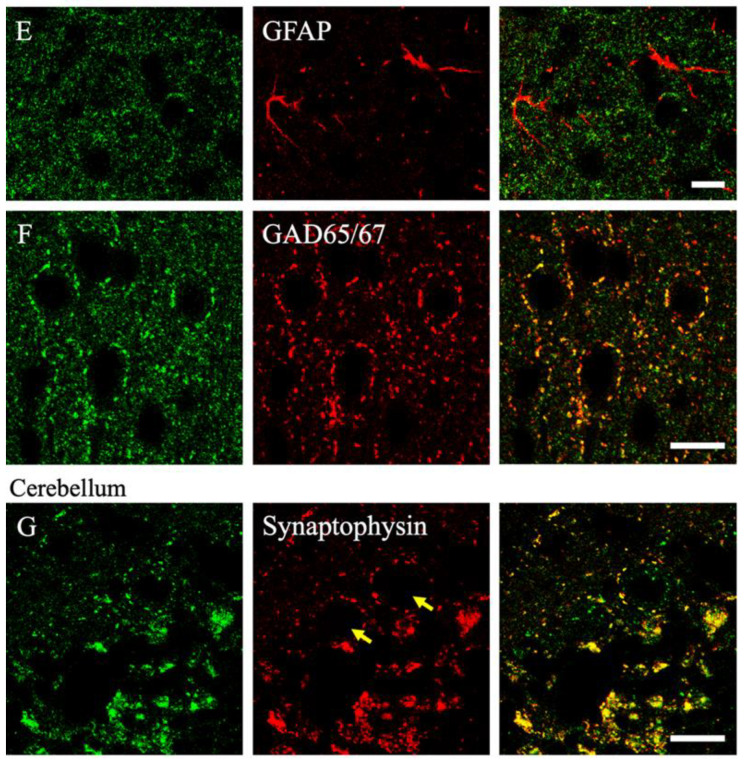
Figure 4.
Laser scanning microscopic images of the double immunofluorescence images of the cerebral cortex (A–F) and cerebellum (G) are shown. Green color indicates the immunoreactivity of MGRN1 (left panels) and red color shows the immunoreactivity of each cell marker (middle panels); merged pictures are shown in the right panels. Yellow arrows in G indicate the Purkinje cells in the cerebellum. All scale bars are 10 μm.


