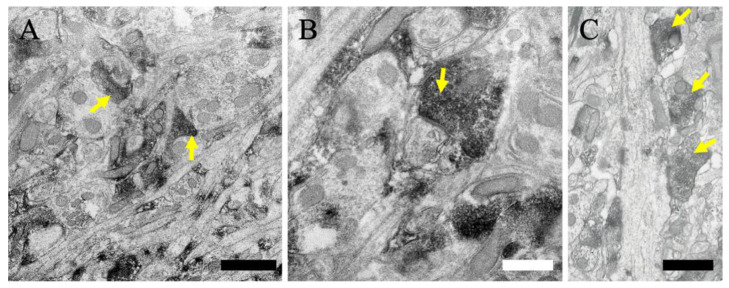
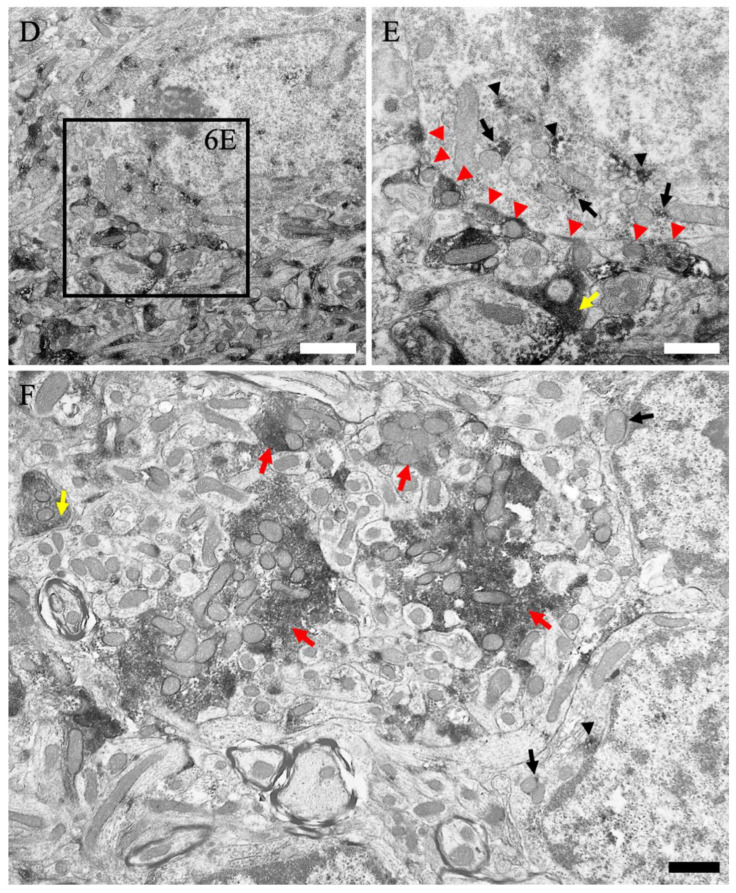
Figure 6.
Immunoelectron microscopic views of the cerebellum are shown. (A–C) The neuropil in the molecular layer. (D,E) The Purkinje cell soma and the neuropil in the Purkinje cell layer; (E) shows a higher magnification view of (D). (F) The granular cell somata and neuropil in the granular cell layer. Black arrows indicate MGRN1 immunoreactivity near the mitochondria. Black arrowheads indicate MGRN1 immunoreactivity near the subcellular organelles; e.g., endoplasmic reticulum. Yellow arrows indicate MGRN1 immunoreactivity in the pre-synapses of axo-dendritic synapses. Red arrowheads indicate MGRN1 immunoreactivity in the pre-synapses of axo-somatic synapses. Red arrows indicate MGRN1 immunoreactivity in the cerebellar glomeruli. Scale bars in (A) and (E) = 1 μm; (B,C,F) = 500 nm; and (D) = 2 μm.


