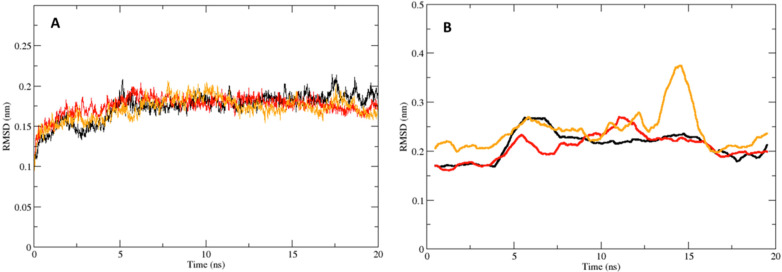
Figure 2.
The RMSDs for the complexes and the compounds. (A) Bla2 backbone RMSD for the Bla2-Compound 4 complex in black, and Bla2-Compound 6 complex in red, and Bla2-SAHA complex in yellow. (B) RMSD of Compound 4 in black, Compound 6 in red, and SAHA in yellow, in relation to the protein backbone. Plotted as running averages for visual clarity.

