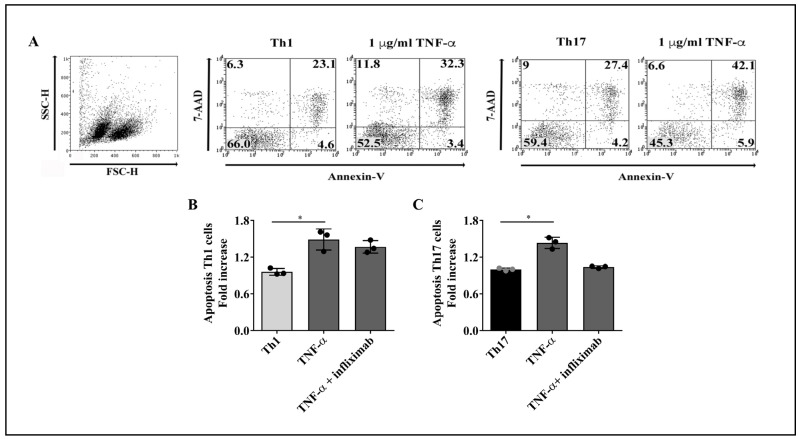
Figure 4.
Effect of TNF-α on Th1 and Th17 cells apoptosis. Purified T cell subpopulations were cultured for 4 days with 1 µg/mL of TNF-α alone or in the presence of a TNF-α neutralizing mAb (infliximab), stimulated with PMA and ionomycin plus brefeldin A for 5 h, stained with annexin-V and 7-AAD, and analyzed by flow cytometry. (A) Representative dot plots of the gating strategy to assess cell apoptosis. Total purified cells were analyzed. The numbers in each quadrant represent the percentage of cells. The effect of TNF-α on cell apoptosis was detected on Th1 (B) and Th17 (C) cells obtained from three healthy donors. Bars represent the mean values ± SD. Data were normalized against cells that did not receive TNF-α or TNF-α plus anti-TNF-α treatment. Statistical analyses were performed with Kruskal–Wallis followed by Dunn’s multiple comparison tests. * p < 0.05.

