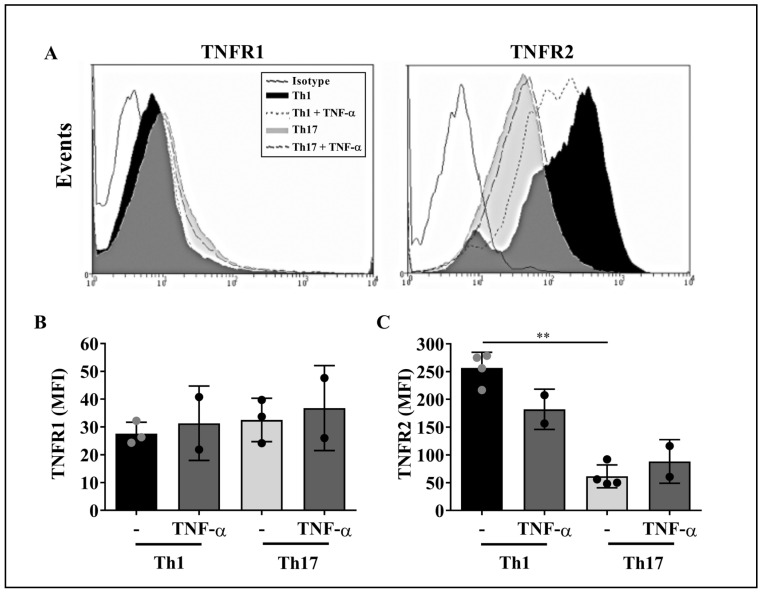
Figure 5.
TNF-α does not impact the levels of TNFR1 and TNFR2 on Th1 and Th17 cells. Purified CD4+ T cell subsets were stimulated with 1 µg/mL of TNF-α for 24 h and stained, for flow cytometry, with anti-human TNFR1 or TNFR2 mAbs. (A) Representative histograms showing the expression levels of TNFR1 and TNFR2 on Th1 and Th17 cells at baseline conditions and upon TNF-α stimulus. Solid black line histograms, isotype control; black histograms, Th1 cells; grey histograms, Th17 cells; dashed line histograms, TNF-α-treated Th1 cells; long dashed line histograms, TNF-α-treated Th17 cells. The levels of TNFR1 (B) and TNFR2 (C) were measured on purified CD4+ T cell subpopulations obtained from two to four healthy controls. Bars represent the mean values ± SD. Statistical analyses were carried out with Kruskal–Wallis followed by Dunn’s multiple comparison tests. ** p < 0.01.

