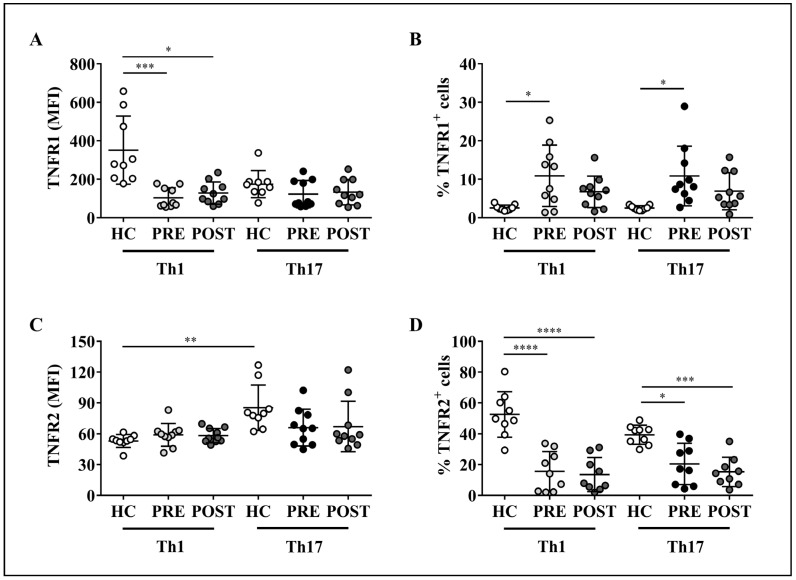
Figure 7.
Expression of TNFR1 and TNFR2 on Th1 and Th17 cells present in the peripheral blood of rheumatoid arthritis (RA) patients treated with adalimumab. Cell staining for flow cytometry analysis was performed on PBMC samples from healthy controls (n = 9) and RA patients (n = 10) before (PRE) and after (POST) treatment with adalimumab. The levels of TNFR1 (A) and TNFR2 (C) are expressed in MFI values. The frequency of TNFR1 (B) and TNFR2 (D)-expressing lymphocytes are also shown. Each symbol represents data for one individual. Mean values ± SD are indicated. Significance was assessed with non-parametric Kruskal–Wallis test followed by Dunn’s multiple comparison test (for MFI data) or parametric one-way ANOVA plus Tukey’s post-test (for lymphocyte frequencies data). * p < 0.05, ** p < 0.01, *** p < 0.001, **** p < 0.0001.

