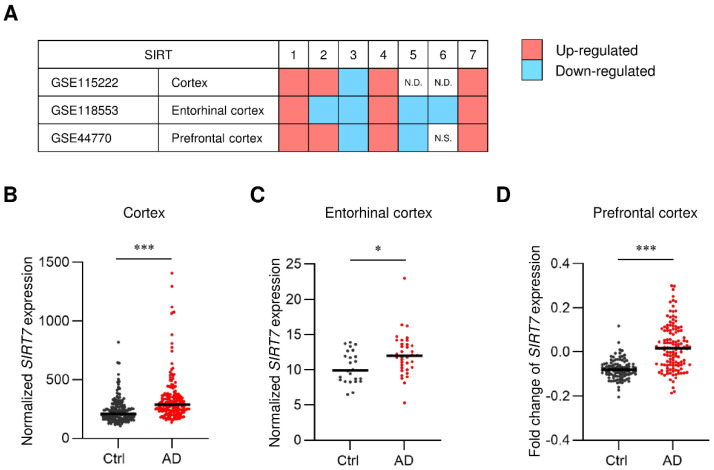
Figure 1.
SIRT7 expression is increased in the brain of AD patients. (A) Meta-analysis comparing three public microarray datasets of patients with AD (GSE15222, GSE118553, and GSE44770). The mRNA expression of SIRT1–7 was compared between AD and control patients. Red and blue boxes represent the upregulation or downregulation of the indicated gene, respectively. N.D., not detected. N.S., not significant. (B–D) Scatter plot of SIRT7 mRNA expression in (B) cortex from 176 non-AD samples and 187 AD samples (GSE15222), (C) entorhinal cortex from 27 non-AD samples and 52 AD samples (GSE118553), and (D) prefrontal cortex from 101 non-AD samples and 129 AD samples (GSE44770). Solid lines indicate the median value for each group. All data are shown as the mean ± SEM. Statistical significance was determined by Student’s t-test. * p < 0.05; *** p < 0.001.

