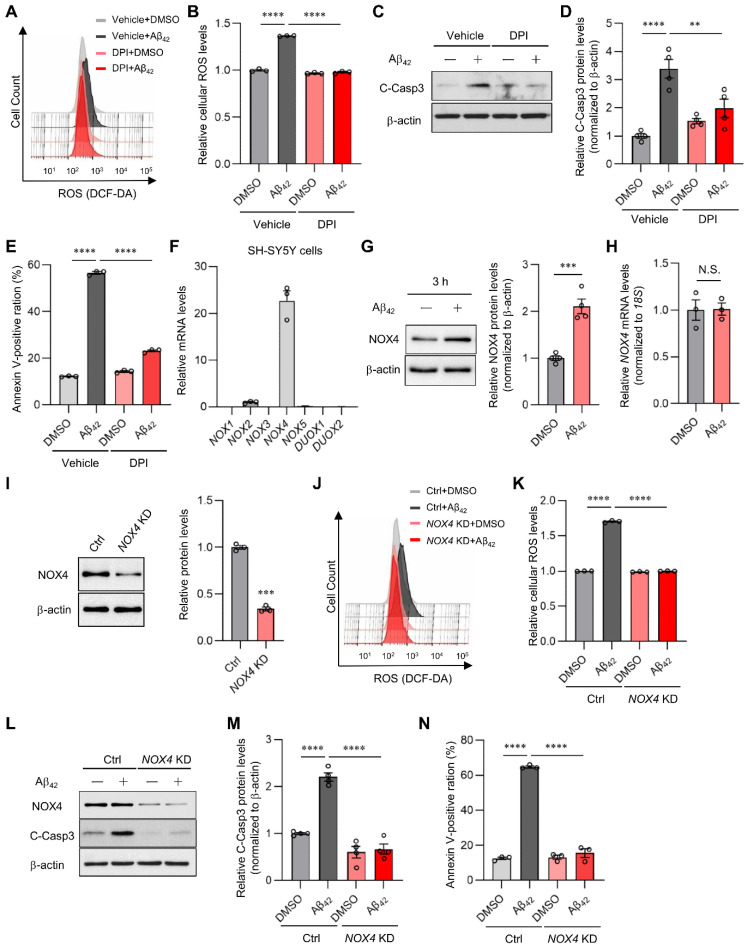
Figure 4.
SIRT7 deficiency suppresses NOX-derived ROS generation. (A) After 0.1 μM DPI pretreatment for 1 h, SH-SY5Y cells were incubated with 5 μM Aβ42 and 0.1 μM DPI for a further 3 h. ROS production was assessed by flow cytometry using DCF-DA. Histogram of DCF-DA intensity in a representative experiment. (B) The geometric mean fluorescence intensity (MFI) ± SEM of three independent experiments was analyzed. (C) SH-SY5Y cells were pretreated with 0.1 μM DPI and then treated with 5 μM Aβ42 for a further 24 h in the presence of 0.1 μM DPI. Cleaved caspase 3 was examined with Western blot analysis. (D) The value of cleaved caspase 3 was normalized to that of β-actin. (E) Flow cytometry analysis was performed using annexin V-FITC/PI staining to assess apoptosis in cells treated in the same condition as in Figure 4C. The percentages of total annexin V-positive cells were calculated. (F) Quantitative RT-PCR analyses were conducted to examine the mRNA levels of the NOX family in SH-SY5Y cells. The expression level of the NOX family was normalized to that of 18S rRNA. (G) SH-SY5Y cells were incubated with 5 μM Aβ42 for 3 h. NOX4 was examined with Western blot analysis. (H) NOX4 mRNA expression was determined by the quantitative real-time RT-PCR analysis of cells treated in the same condition as that in Figure 4G. The value of NOX4 mRNA was normalized to that of 18S rRNA. (I) NOX4 KD efficiency was confirmed with Western blot analysis when SH-SY5Y cells were transfected with NOX4 siRNA for 48 h. (J) Intracellular ROS levels were evaluated by flow cytometry after control, and NOX4 KD SH-SY5Y cells were treated with Aβ42 for 3 h. Histogram of DCF-DA intensity of a representative experiment. (K) For the quantification of intracellular ROS levels, the geometric MFI ± SEM of three independent experiments was analyzed. (L) After SH-SY5Y cells had been transfected with control and NOX4 siRNA for 48 h, the cells were treated with Aβ42 for 24 h. Cleaved caspase 3 protein was evaluated with Western blot analysis. (M) The value of cleaved caspase 3 was normalized to that of β-actin. (N) Flow cytometry analysis was performed using annexin V-FITC/PI staining to assess apoptosis in cells treated in the same condition as that in Figure 4L. The percentage of total annexin V-positive cells was calculated. All data are shown as the mean ± SEM. Statistical significance was determined by either Student’s t-test or two-way ANOVA with Tukey’s post hoc test. N.S., not significant; ** p < 0.01; *** p < 0.001; **** p < 0.0001.

