Figure 1.
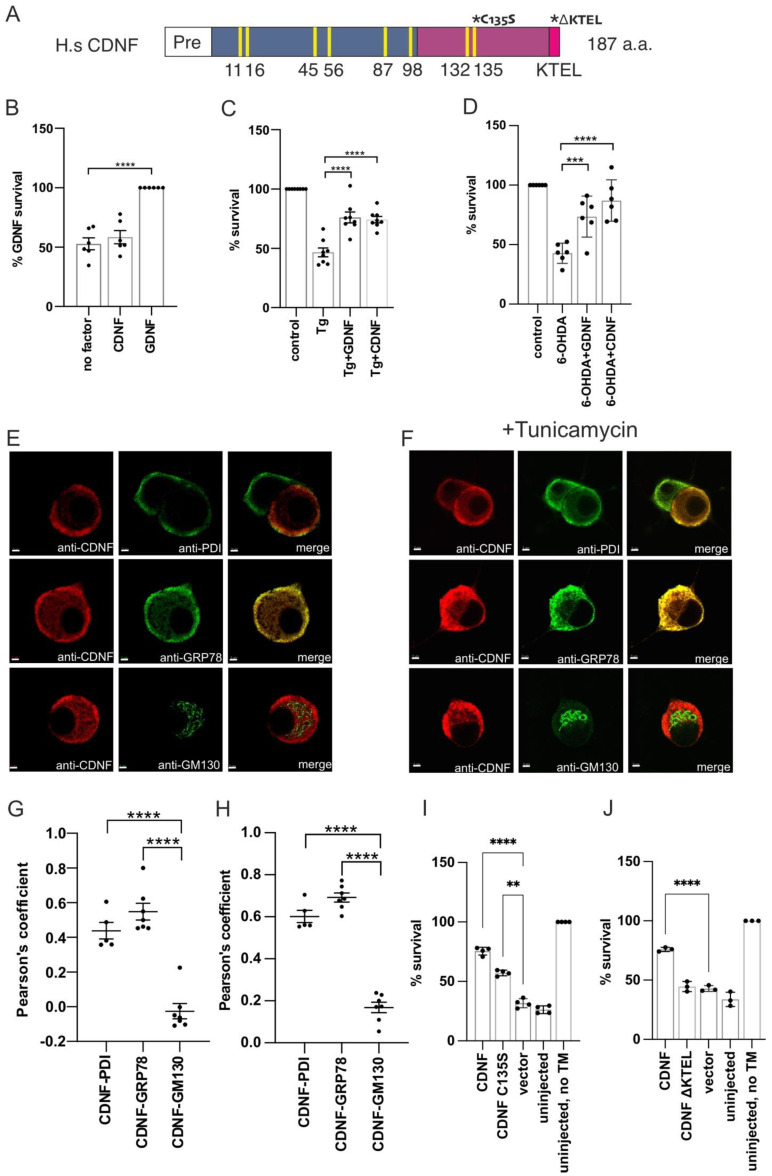
CDNF is an ER–localized protein that promotes survival of ER-stressed neurons in vitro. (A) Schematic primary structure of human CDNF. The ER-targeting (Pre) sequence is marked as white, the N-terminal domain as blue, the C-terminal domain as mauve, and the very C-terminal KDEL-like ER retention signal (KTEL) as bright pink. Yellow bars mark the conserved cysteine residues, numbered according to the mature protein. Asterisks mark CDNF mutations used in this study. Pro-CDNF is 187 amino acids long. CDNF numbering starts from the N-terminus on mature CDNF. (B) Midbrain dopamine (DA) neuron cultures from E13.5 mice were cultured in the presence of CDNF or GDNF at 100 ng/mL or culture media without neurotrophic compound (no factor) for 5 days. DA neurons were identified by tyrosine hydroxylase (TH) immunostaining and expressed as % of cell survival in each condition compared to GDNF-treated neurons. Shown are the means ± S.D. of 6 independent experiments per condition. Data were analyzed by ordinary one-way analysis of variance (ANOVA) and Sidak’s multiple comparisons post hoc test. (C) E13.5 mouse midbrain floor cultures were treated with 100 nM thapsigargin (Tg) only or Tg and the indicated growth factors from DIV 5 to DIV 8. After three days TH-positive neurons were counted and expressed as a percentage of non-Tg-treated neurons. Shown are the means of 8 experiments ± S.D. Tg-treated group was compared to either Tg+CDNF or Tg+GDNF group using ordinary ANOVA and Sidak’s multiple comparison post hoc test. (D) E13.5 mouse midbrain DA cultures were treated with 10 μM 6-OHDA only or 6-OHDA and the indicated growth factors from DIV 5 to DIV 8. After three days, TH-positive neurons were counted and expressed as a percentage of non-6-OHDA treated neurons. Shown are the means of 6 experiments ± S.D. The 6-OHDA-treated group was compared to either 6-OHDA+CDNF or 6-OHDA+GDNF group using ordinary ANOVA and Sidak’s multiple comparison post hoc test. (E,F) CDNF localization in mouse superior cervical ganglion (SCG) neurons by immunofluorescence. Neurons were microinjected with CDNF expression plasmid (E) and treated with 2 µM tunicamycin (F). CDNF protein colocalized with ER markers PDI and GRP78 but not with the Golgi marker GM130. Pearson’s colocalization coefficients were calculated from randomly selected 5–7 individual neurons per indicated immunostaining pair from E (G) and F (H) using Imaris x64 software and analyzed by ordinary one-way ANOVA. Scale bar is 3 μm. E, embryonic day; DIV, days in vitro. (I,J) SCG neurons isolated on postnatal day 1 or 2 were injected with plasmid vector encoding CDNF or indicated CDNF mutants and treated with 2 µM tunicamycin to induce ER stress-related apoptosis. The number of living injected, GFP-positive neurons was calculated 72 h after the injections and expressed as the percentage of initially injected neurons. Shown are the means of 3 experiments ± S.D. CDNF plasmid-injected groups were compared to the empty vector using one-way ANOVA and Sidak’s multiple comparison post hoc test. *, **, ***, and **** denote p < 0.05, p < 0.01, p < 0.001, and p < 0.0001. The null hypothesis was rejected at p < 0.05.

