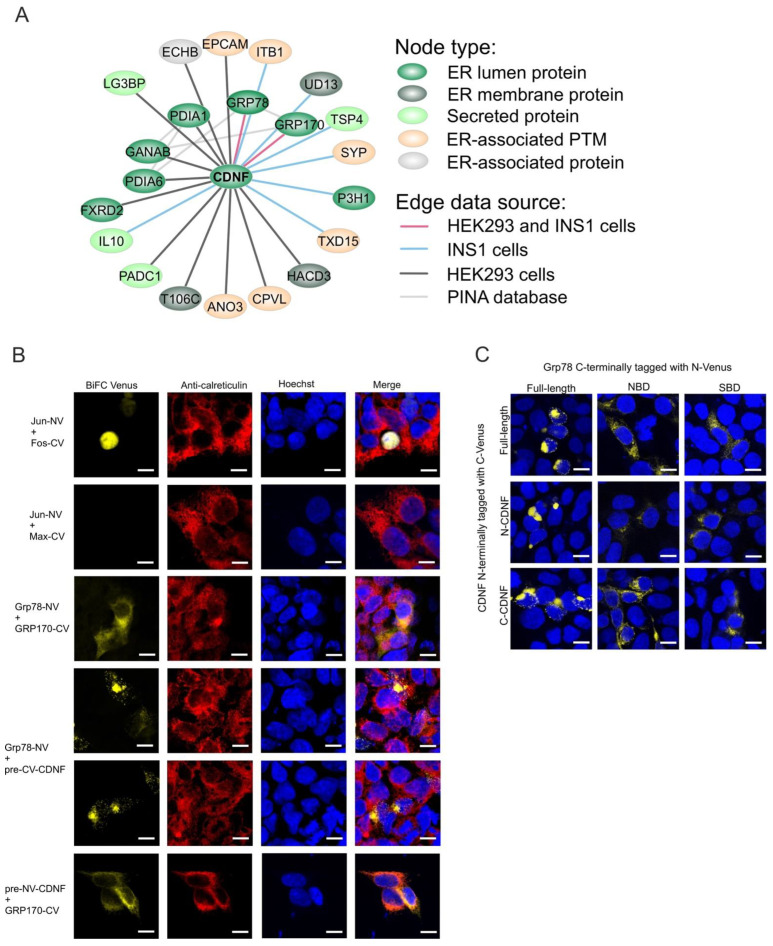
Figure 6.
The ER-localized interactome of CDNF. (A) An interaction map consisting of a subset of ER-localized or ER-associated proteins in the CDNF interactome from both HEK293 and INS1 cell lines. Node color coding represents the subcellular location in respect to ER of each node based on its respective UniProtKB database entry. Edge color represents the origin of the respective interaction data. (B) CDNF interaction with GRP78 and GRP170 in HEK293 cells by bimolecular fluorescence complementation (BiFC) assay. Yellow fluorescent signal indicates interaction between the tested proteins. Jun-NV+Fos-CV and GRP78-NV+GRP170-CV pairs were used as positive controls as BiFC signal formation in the nucleus and ER, respectively. Jun-NV+Max-CV pair was used as a negative control for signal formation. ER was visualized by anti-calreticulin immunostaining (red) and nuclei by Hoechst staining (blue). (C) HEK293 cells were co-transfected with the indicated CDNF and GRP78 BiFC plasmids and nuclei were visualized by Hoechst staining. White scale bars denote 10 µM. NBD, nucleotide-binding domain; SBD, substrate-binding domain of GRP78. Shown are representative images from n = 3–5 independent experiments per binding pair.

