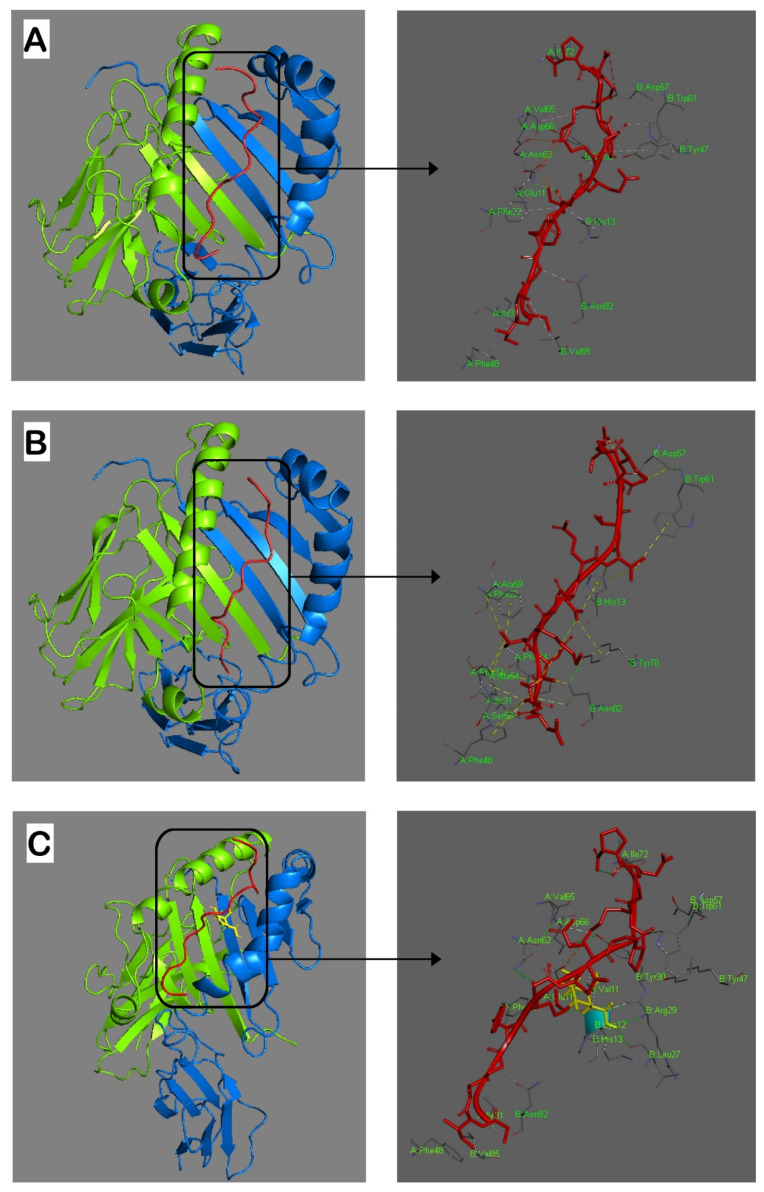
Figure 1.
Graphical representation of interaction analyses between the HLA-DRB1*04:01 molecule and the studied peptides (red). (A): CII259-273; (B): ASNase67-81; (C): Gal264-CII259-273. Hydrogen bonds are indicated by dashed lines. Amino acid residues from both α and β chains important for interactions with the peptides are shown in bright green. Gal264 in CII259-273 peptide is yellow. Alpha and beta chains of the MHCII are bright green and blue, respectively. The docking was conducted by using ClusPro 2.2 and the results were visualized using Discovery Studio 2016 V16.1.0.

