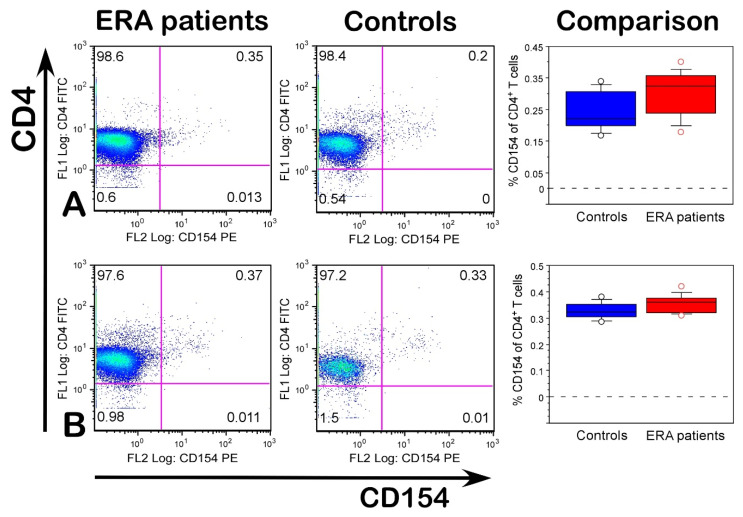
Figure 4.
Percentage of CD154+CD4+ T cells in ERA patients and healthy individuals after in vitro stimulation with huCII (A) and bacterial L-asparaginase (B). In the last column, (comparison) data are presented as means ± SE. Flow cytometry analyses were performed by using a Cytomics FC500 flow cytometer.

