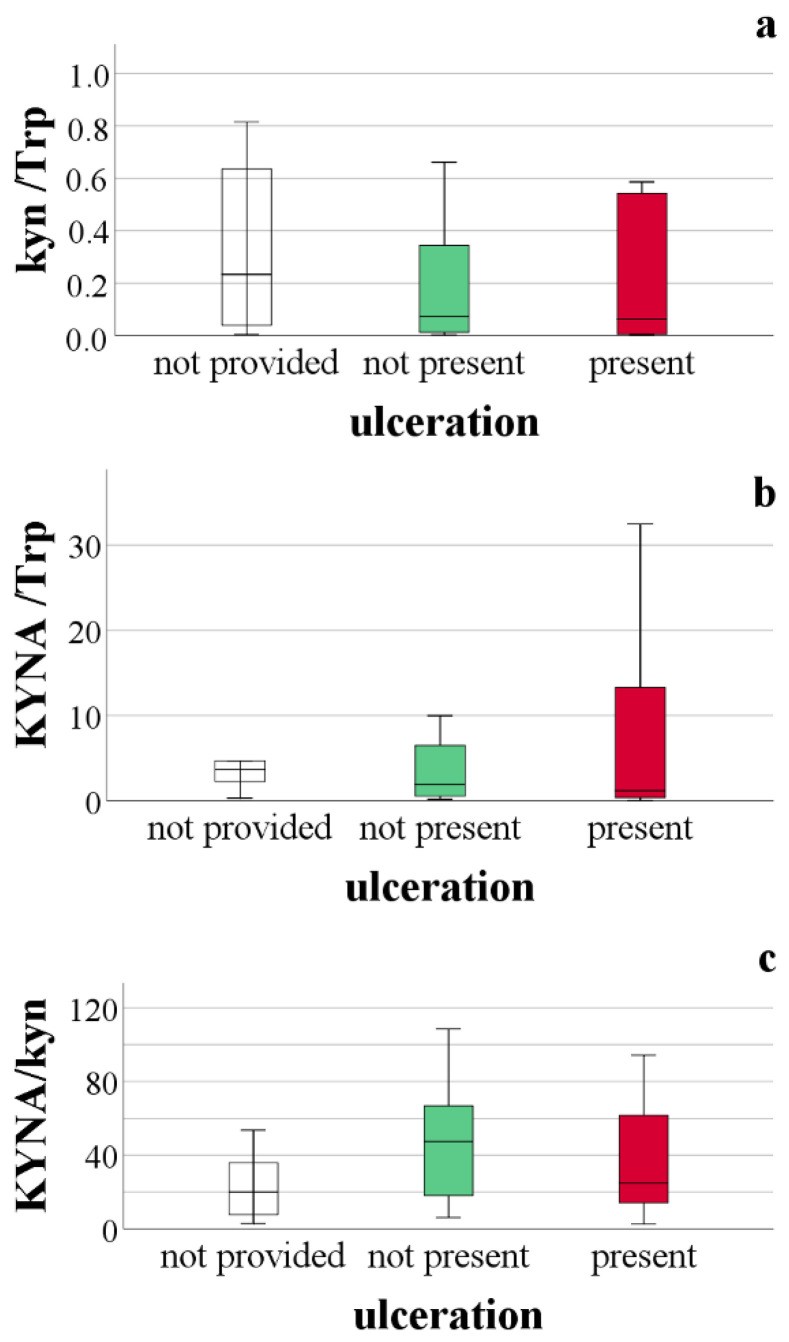
Figure 3.
Comparison of kynurenine pathway metabolites based on the presence of ulceration. (a) comparison of kynurenine level relative to tryptophan concentration, based on the presence of ulceration, p = 0.3199; (b) comparison of kynurenic acid level relative to tryptophan concentration, based on the presence of ulceration, p = 0.412; (c) comparison of kynurenic acid level relative to kynurenine concentration, based on the presence of ulceration, p = 0.209.

