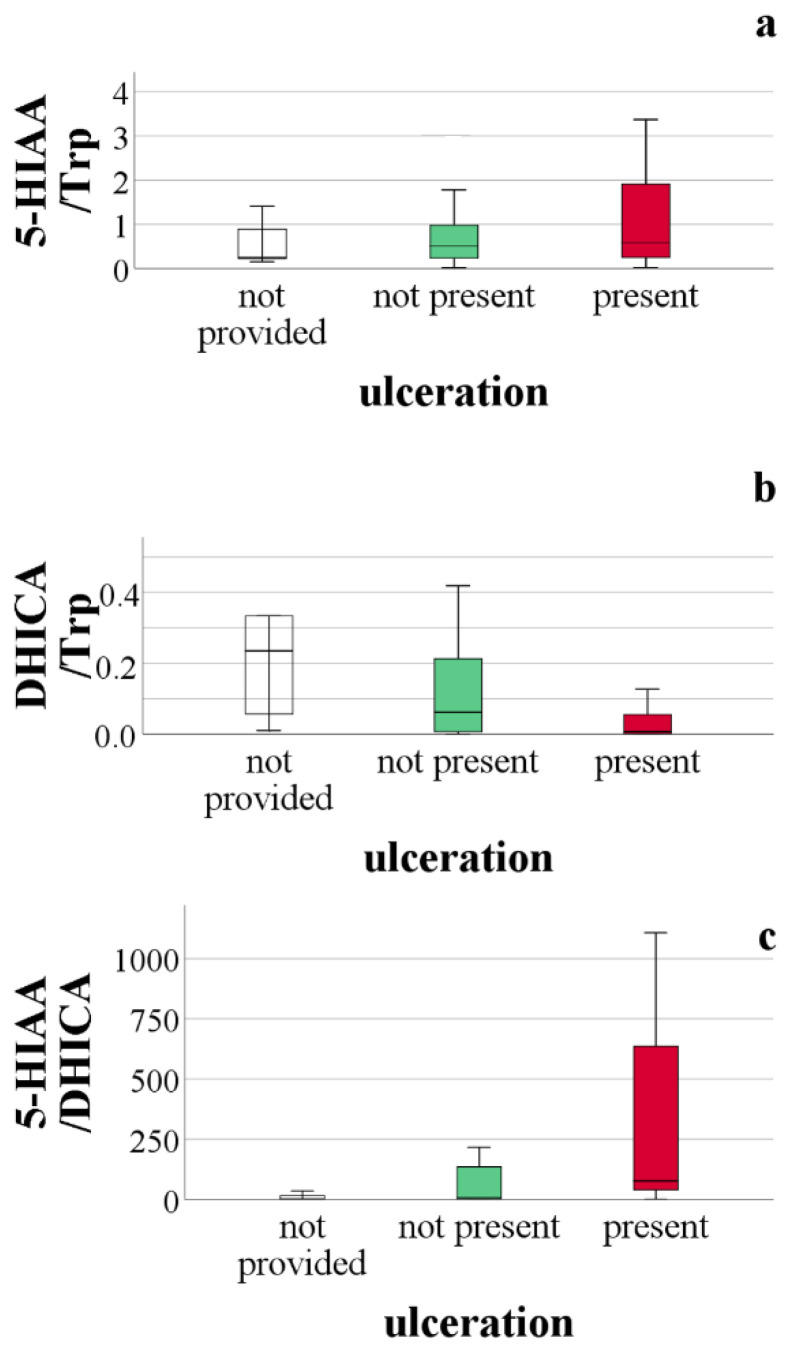
Figure 4.
Comparison of serotonin pathway metabolites based on the presence of ulceration. (a) comparison of 5-hydroxyindole-3-acetic acid level relative to tryptophan concentration, based on the presence of ulceration, p = 0.223; (b) comparison of 5,6-dihydroxyindole-2-carboxylic acid level relative to tryptophan concentration, based on the presence of ulceration, p = 0.171; (c) comparison of 5-hydroxyindole-3-acetic acid level relative to 5,6-dihydroxyindole-2-carboxylic acid concentration, based on the presence of ulceration, p = 0.210.

