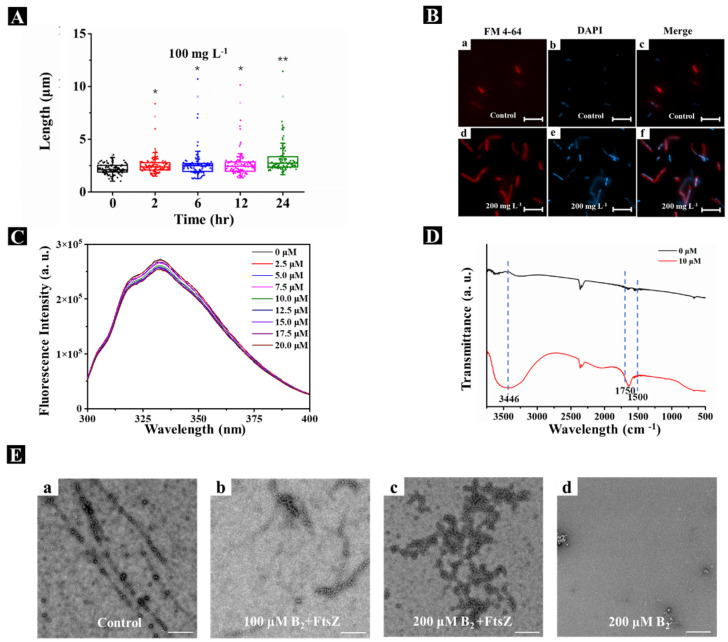
Figure 5.
Mechanism of action for compound B2 targeting XooFtsZ. (A) Statistical data of the lengths of Xoo cells from TEM images after incubation with 100 mg L−1 compound B2 for different intervals of time. (B) The fluorescence patterns for the Xoo cells affected by 200 mg L−1 DMEP for 24 h. The cell membranes were visualized by FMTM 4−64FX and are shown in red; the DNA was visualized by DAPI and is shown in blue. Shown are control cells (a,b) and overlay (c); in the presence of 200 mg L−1 compound B2 (d,e) and overlay (f). The scale bars are 5 μm. (C) Fluorescence titration experiments of XooFtsZ (10 μM) with different concentrations (ranging from 0 μM to 20 μM) of compound B2, λex = 280 nm, λem = 334 nm. (D) FT−IR spectra of pure XooFtsZ (black line, 30 µM) and XooFtsZ-B2 complex (red line, 30 µM XooFtsZ was incubated with 10 µM compound B2). (E) Transmission electron micrographs of XooFtsZ polymers after incubation with different concentrations of compound B2. (a) 0 μM compound B2 + 20 μM XooFtsZ, (b) 100 μM compound B2 + 20 μM XooFtsZ, (c) 200 μM compound B2 + 20 μM XooFtsZ, (d) 200 μM compound B2 without XooFtsZ. Scale bars are 1 μm. Asterisks represented significant differences in comparison to control through used SPSS 20.0 software with Duncan (D) adjustment: (*) p < 0.05 and (**) p < 0.01.

