Figure 2.
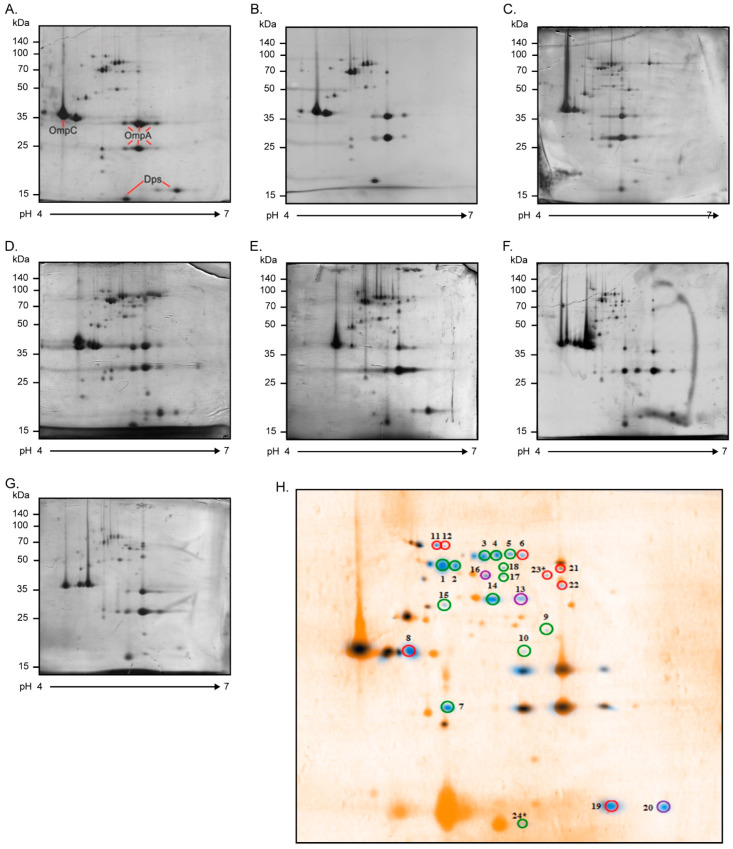
OMP profiles of AIEC strains. Two-dimensional polyacrylamide gel electrophoresis (2D-PAGE) OMP profiles of the AIEC strains grown in DMEM (2% bile salts) at 37 °C overnight: (A) 4I01, (B) 4C01, (C) 5I01, (D) 6I09, (E) 9C01, (F) 10I01, and (G) 18I08. Twelve percent polyacrylamide gels (13 cm; pH range: 4–7) were stained with Coomassie blue G-250. The scale bars on the left indicate molecular weights in kDa. Proteins with a well-known 2D-PAGE pattern are indicated (OmpA, OmpC, and Dps). (H) A representative AIEC OMP profile (blue spots) involving all the proteins present in at least 70% of the strains was superimposed on the commensal E. coli HS protein profile (orange spots). This analysis was performed using BioNumerics 2D software (v6.6). A total of 24 protein spots expressed differentially were selected and identified with MALDI-TOF/TOF mass spectrometry. These spots were absent in the HS OMP profile and highly frequent in the AIEC OMP profiles, as follows: 7/7 (100%, enclosed in green), 6/7 (86%, enclosed in purple), and 5/7 (71%, enclosed in red). * Spots 23 and 24 had no significant e-values in the MALDI-TOF/TOF analysis and were therefore discarded.

