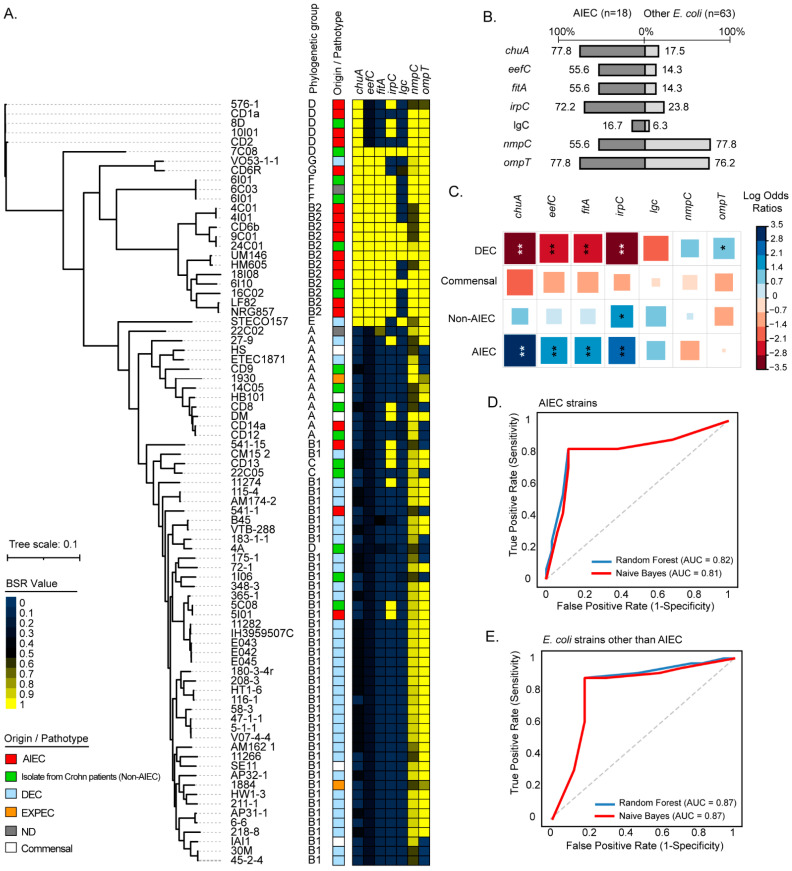
Figure 3.
Phylogenetic distribution and prevalence of the chuA, eefC, fitA, irpC, lgC, nmpC, and ompT genes among AIEC strains. (A) The maximum parsimony phylogenetic tree (midpoint rooted) was based on 7515 core SNPs identified in 81 complete or draft genomic sequences of E. coli strains. Phylogenetic groups are indicated. The origin/pathotype of each isolate is indicated by colored boxes according to the legend. The presence, absence, and variation of each gene are indicated by the color scale, which represents the blast score ratio (BSR) values. A value of 1 indicates the presence of a gene encoding an identical protein. (B) Prevalence of the genes in AIEC and other E. coli strains. Numbers indicate gene prevalence in percentages in relation to the total strains in each group. (C) Pairwise association plot for pathotypes and the indicated genes. Red and blue squares represent negative and positive associations, respectively. The color scale represents the magnitude of the association determined by odds ratios. * p < 0.05, ** p < 0.005 determined by Pearson’s chi-square test or Fisher’s exact test. (D,E) Evaluation of the chuA, fitA, and eefC genes as molecular markers to discriminate AIEC strains from other E. coli strains. The random forest and naive Bayes classification methods were implemented. The performance of each classifier model is represented by ROC curves and the area under the curve (AUC).

