
Figure 2.
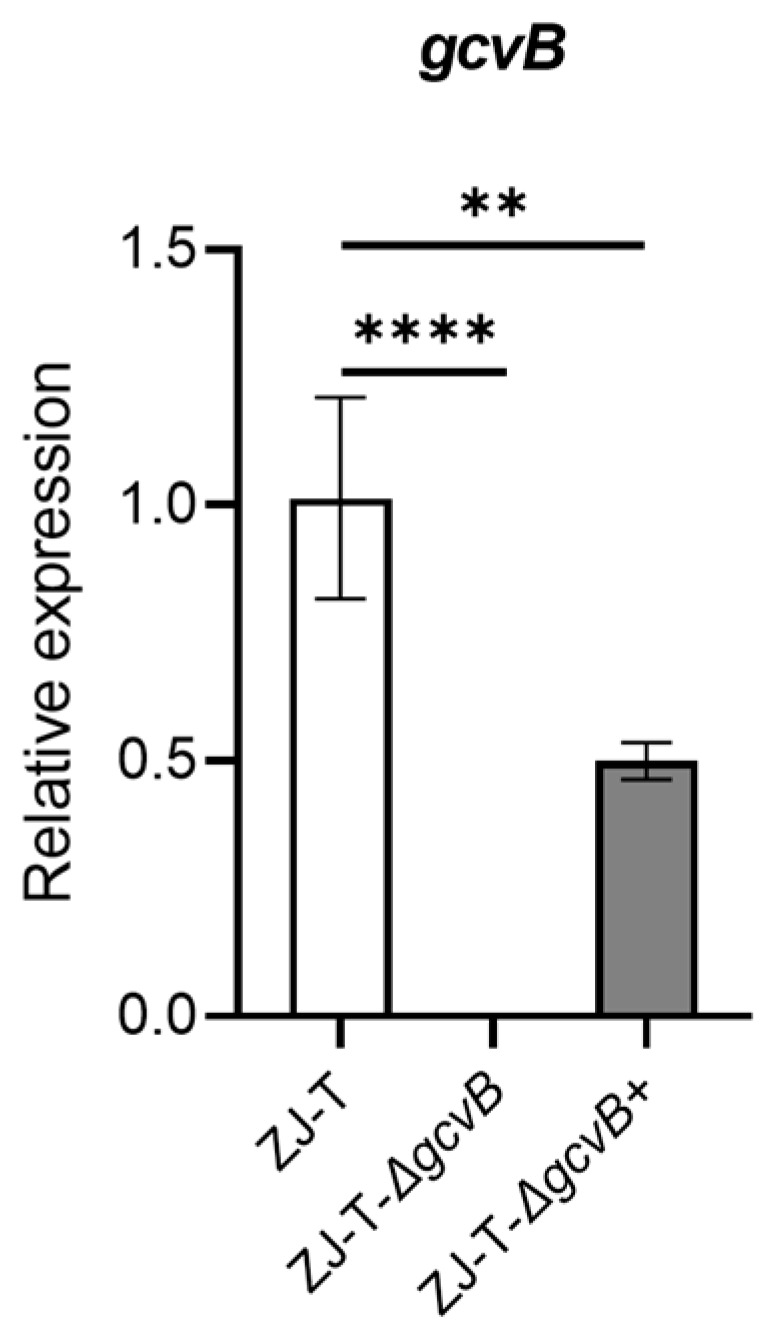
The relative expression of gcvB in wildtype, gcvB mutant and complementary strains (Student ’s t-test, p value: **, <0.01, ****, <0.0001). The levels of gcvB were normalized to the internal control 16S rRNA level. Error bars indicate standard deviations.