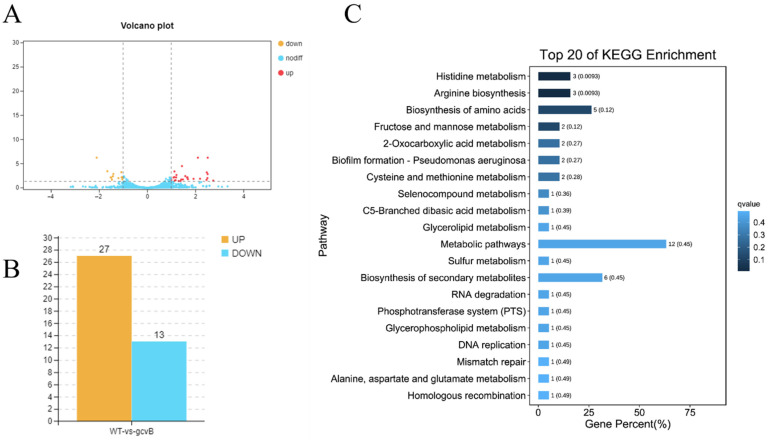
Figure 4.
Overview of RNA transcriptomic profiles of wildtype and gcvB mutant strains. (A) Volcanic map of differential genes in transcriptome (FDR < 0.05, |log2(fold change)| ≥ 1). The red dot represents significantly up-regulated difference; the yellow dot represents significantly down-regulated difference; the blue dot represents no difference; (B) Statistical column chart of differential expressed genes. WT: wild-type strain Vibrio alginolyticus ZJ-T; gcvB: gcvB knockout strain ZJ-T-△gcvB; (C) histogram of top 20 of KEGG pathway enrichment in transcriptomics after inactivation of gcvB.

