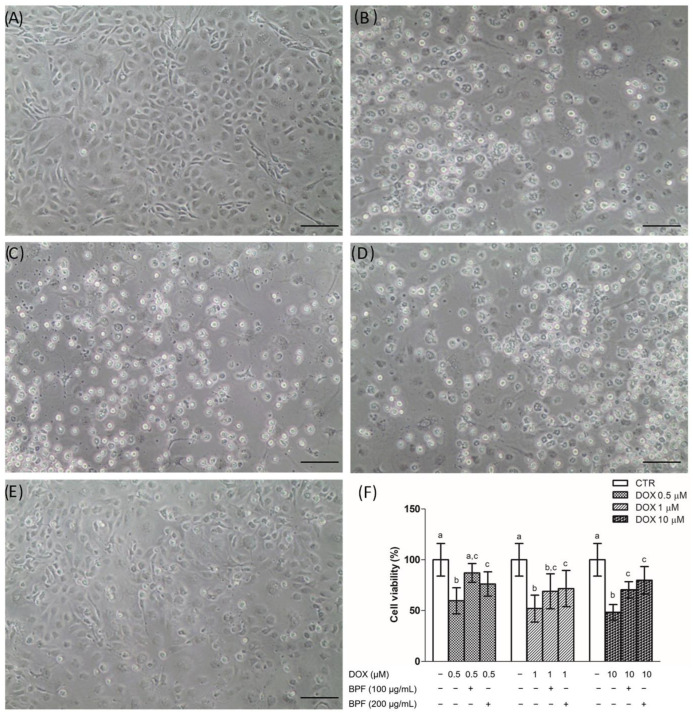
Figure 1.
Effect of BPF on DOX-induced pAEC cytotoxicity. (A–E) Representative images of pAECs treated with DOX 0.5, 1, 10 µM (B,C,D, respectively) in the absence or presence of 100 µg/mL BPF (E). (F) Cell viability quantification: each bar represents the mean ± SD of three independent experiments. Scale bar (―) 100 µm. Different letters above the bars indicate significant differences (p < 0.05, one-way ANOVA, post hoc Tuckey comparison test) between each DOX treatment with and without BPF and the control (CTR) group.

