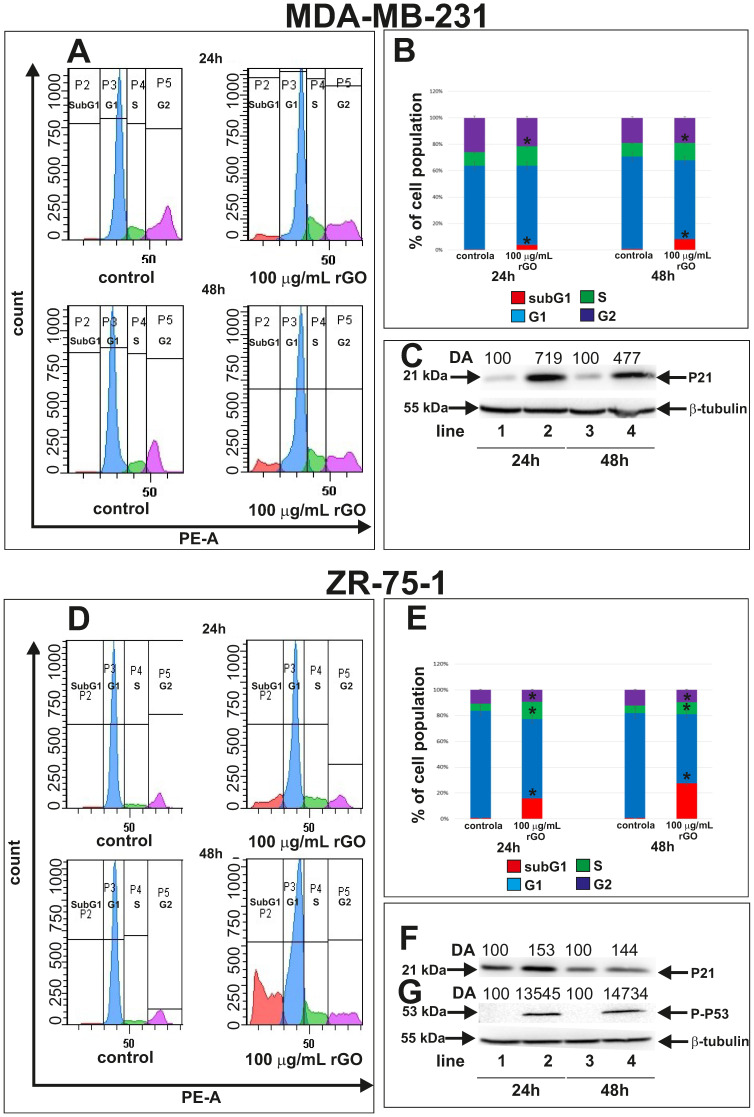
Figure 2.
Flow cytometric analysis of MDA-MB-231 (A) and ZR-75-1 (D) cells treated with 100 µg/mL of rGO and later stained with propidium iodide. Histogram representation of the cell cycle profiles obtained from flow cytometry measurements (A,D) and a bar graph presenting the percentage of cell cycle distribution in MDA-MB-231 (B) and ZR-75-1 (E) cells. Western blot and densitometric analysis of P21 expression in MDA-MB-231 (C) and ZR-75-1 (F) and P-P53 expression in ZR-75-1 (G) cells incubated with 100 µg/mL rGO for 24 and 48 h. Samples containing 15 μg of protein were submitted to electrophoresis and immunoblotting. Densitometric analysis (DA) was presented as a relative fold change in comparison to untreated controls, expression level of which was set as 100. The expression of β-tubulin served as a control for protein loading. Mean values of flow cytometry analysis from three independent experiments ± SD are presented. * p < 0.05.

