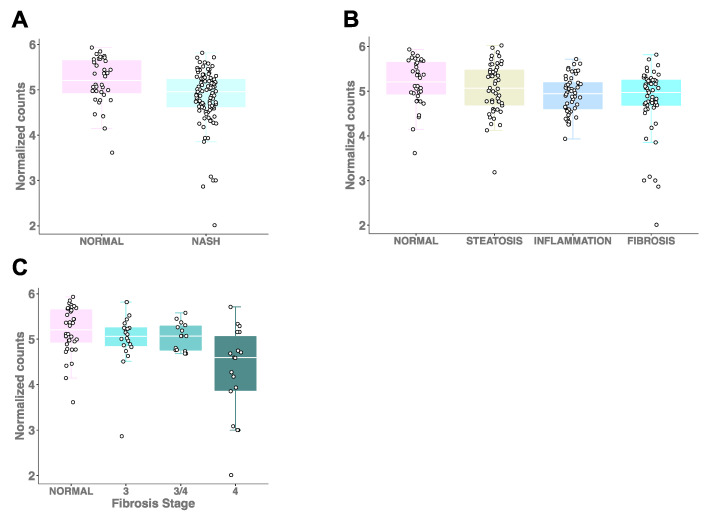
Figure 1.
Hepatic PEMT expression decreases with increasing severity of NAFLD. (A) PEMT expression in individuals with NASH (inflammation and fibrosis) and those with normal liver histology (β = −1.497; p = 0.005). (B) PEMT expression levels in participants spanning the histological spectrum of NAFLD (β = −909; p = 2.2 × 10⁻⁴). The expression levels were significantly different when comparing inflammation and fibrosis groups with controls (β = −1.476; p = 0.015) and (β = −1.504; p = 0.013, respectively), but not when comparing steatosis with controls (β = −0.550; p = 0.222). (C) PEMT expression in different fibrosis stages and controls (β = −0.152; p = 0.001).

