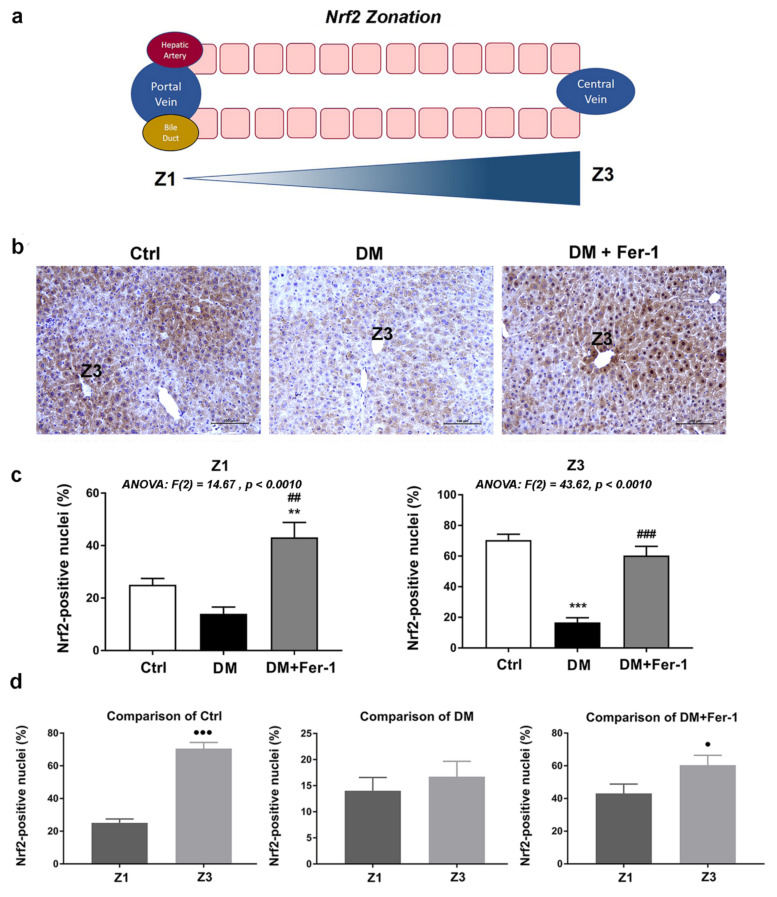
Figure 4.
Immunohistochemistry of Nrf2 in liver tissue of control (Ctrl), diabetic (DM), and diabetic Fer-1-treated (DM + Fer-1) animals. (a) Schematic overview of structural zonation of the liver. (b) Immunohistochemical detection of Nrf2 expression across the liver zones; scale bars—50 µm. (c) Proportion of Nrf2 positive nuclei between the groups in Z1 and Z3. (d) Proportion of Nrf2 positive nuclei between the zones in control, DM, and DM + Fer-1 groups. Values presented as means ± SEM. Statistical significance: compared with the Ctrl group (*), ** p < 0.01; *** p < 0.001; DM vs. DM + Fer-1 comparison (#), ## p < 0.01; ### p < 0.001. Z1 vs. Z3 comparison (●), ● p < 0.05, ●●● p < 0.001.

