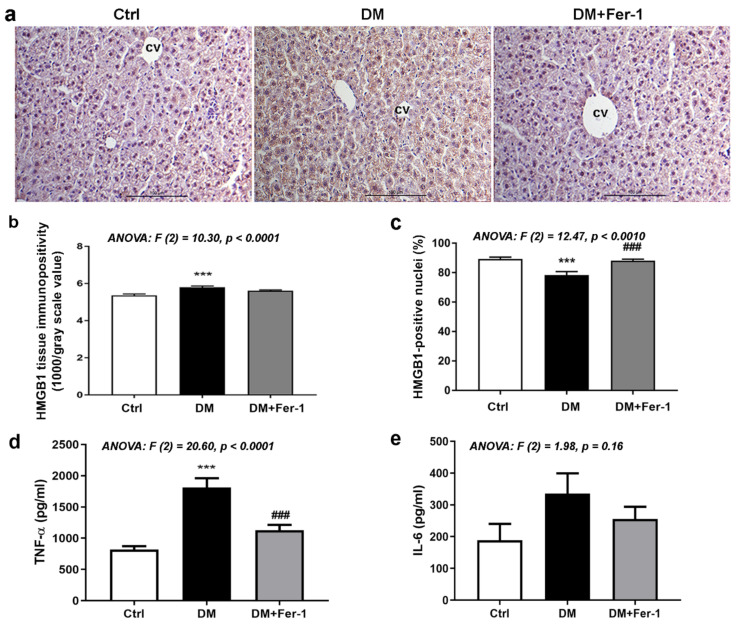
Figure 6.
HMGB1, TNF-α, and IL-6 in liver tissue of control (Ctrl), diabetic (DM), and diabetic Fer-1-treated (DM + Fer-1) animals. (a) Immunohistochemical detection of HMGB1; scale bars—50 µm. (b) Quantification of tissue and (c) nuclear immunopositivity of HMGB1. Protein level of TNF-α (d) and IL-6 (e) measured by ELISA. Values presented as means ± SEM. Statistical significance: compared with the Ctrl group (*), *** p < 0.001. DM vs. DM + Fer-1 comparison (#), ### p < 0.001.

