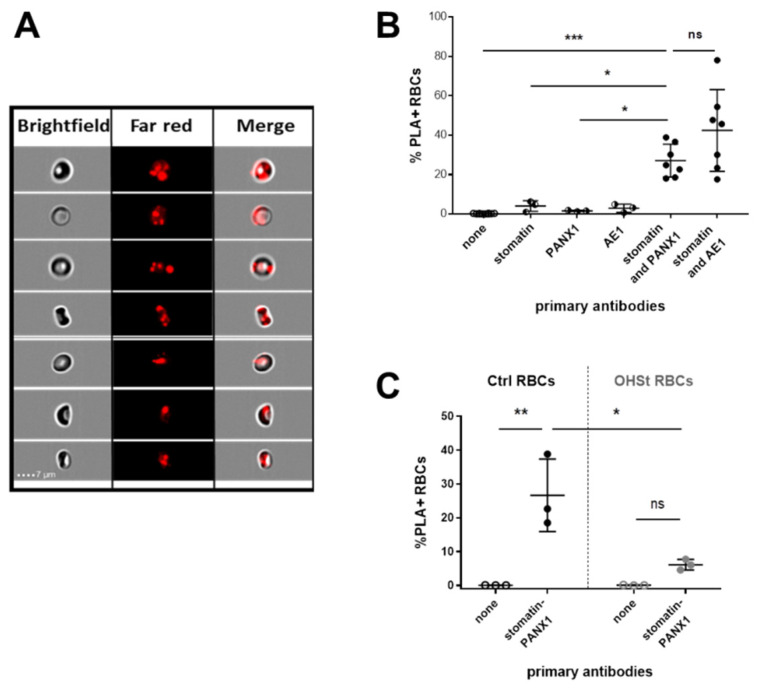
Figure 3.
Stomatin and PANX1 proximity in control and OHSt RBCs assessed by Proximity Ligation Assay (PLA) and analyzed by Imaging Flow Cytometry. (A) PLA-positive (PLA+) events characterized by red spots which result from the detection oligos coupled to fluorochromes (FarRed) hybridizing to sequences in the amplified DNA were visualized by Imaging Flow Cytometry and merged with Brightfield images of the corresponding Control RBCs. (B) Quantification of the assay corresponding to the percentage of PLA+ RBCs was performed several times in different conditions: without any primary antibody (none, N = 10), with only one antibody (anti-stomatin or anti-PANX1 or anti-AE1, N = 3 for each condition) and in the presence of two antibodies (anti-stomatin + anti-PANX1 or anti-stomatin + anti-AE1, N = 7 in both conditions). A comparison was performed using an unpaired One-way Anova Tukey’s test. (C) PLA using anti-stomatin + anti-PANX1 was performed in identical conditions to those described above but on frozen/thawed control (Ctrl) and OHSt RBCs and compared using paired or unpaired (between control and OHSt) Two-way Anova Sidak’s multiple comparisons test (p values > 0.05: ns, ≤0.05: *, ≤0.01: ** and ≤0.001: ***). ns stands for not significant.

