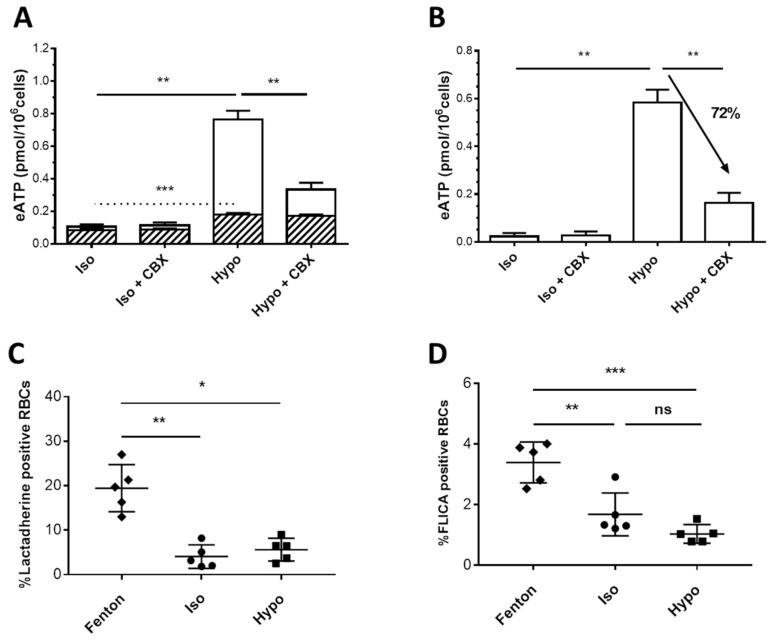
Figure 4.
Activation of ATP release in fresh RBCs by a hypoosmotic challenge. (A) RBC suspensions were exposed to isoosmotic (Iso) or hypoosmotic (Hypo, 240 mOsm/kg) stimulation. Experiments were performed with or without preincubation with 100 μM CBX, a PANX1 inhibitor. Results are expressed as eATP (pmol/106 cells). The hemoglobin concentration of paired samples was used to estimate lytic eATP. A stacked graph was built to show the contribution of lytic ATP (hatched bars) within total ATP release from RBCs. Lytic and total eATP values were compared using a One-Way ANOVA Dunnett’s test for Multiple Comparisons (N = 5). The results shown are mean values ± SEM. (B) The difference between total eATP and lytic eATP was calculated and denoted as non-lytic eATP. Non-lytic eATP values were compared using a One-Way ANOVA Dunnett’s test for Multiple Comparisons. (C) PS exposure was measured by flow cytometry on Lactadherin-FITC stained RBCs in basal conditions after treatment with Fenton’s reagent, as a control of eryptosis, and in basal or hypoosmotic conditions without Fenton. (D) Caspase activation was measured under conditions similar to PS exposure but on FLICA 660 caspase3/7-stained RBCs. The statistical analysis of the last two measurements (N = 5) was performed using an RM-one-way ANOVA test. (p values > 0.05: ns, ≤0.05: *, ≤0.01: ** and ≤0.001: ***). ns stands for not significant.

