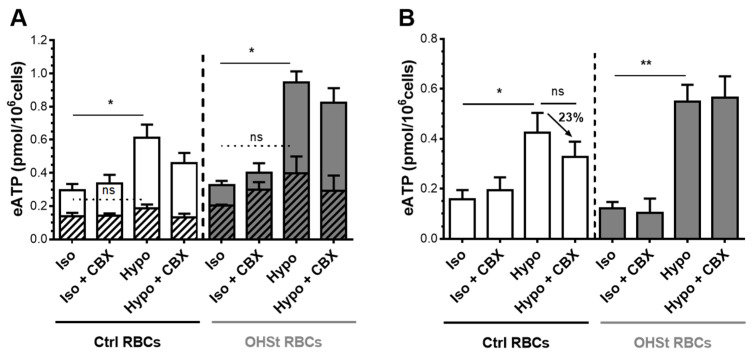
Figure 5.
Activation of ATP release in frozen/thawed and rejuvenated RBCs from controls and OHSt patients. Suspensions of frozen/thawed and rejuvenated RBCs were exposed to isoosmotic (Iso) or hypoosmotic (Hypo, 240 mOsm/kg) stimulation. Experiments were performed with or without preincubation with 100 μM CBX, a PANX1 inhibitor. Results are expressed as eATP (pmol/106 cells). (A) Stacked graph showing total eATP including lytic eATP (hatched bars) released from control (white bars) or OHSt (grey bars) RBCs. The hemoglobin concentration of paired samples was used to estimate lytic eATP. (B) Non-lytic eATP was calculated as the differences between total eATP and lytic eATP. Total, lytic, and non-lytic eATP values were compared using a One-Way ANOVA Dunnett’s test for Multiple Comparison (N = 3). The results shown are mean values ± SEM. (p values > 0.05: ns, ≤0.05: *, ≤0.01: **). ns stands for not significant.

