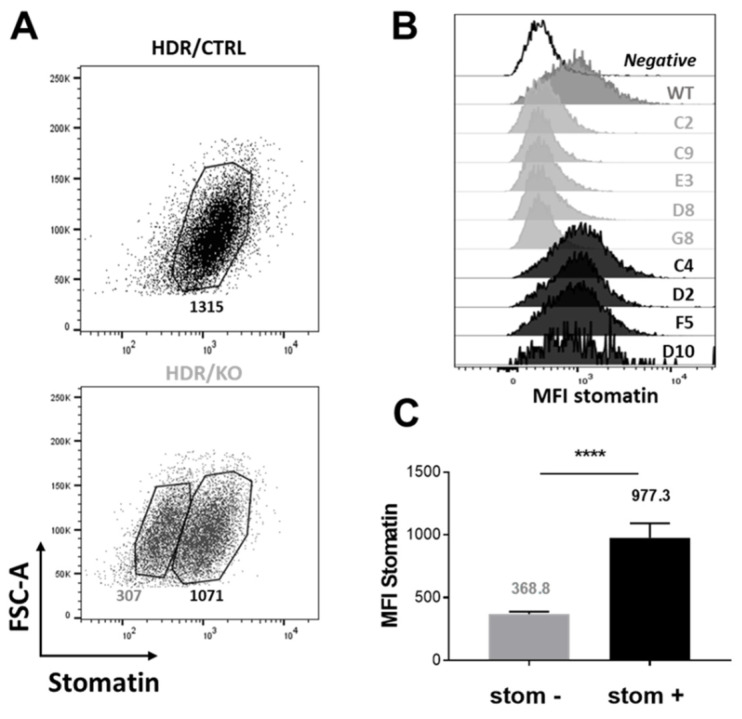
Figure 8.
Stomatin deficiency on stomatin Knockout transfected K562 cells and generation of stom+ and stom− clones. (A) Stomatin expression was assessed by flow cytometry on puromycin-resistant K562 cells after co-transfection with stomatin Homology-Directed DNA Repair (HDR) plasmids together with either control CRISPR/Cas9 (CRISPR Control) or stomatin CRISPR/Cas9 Knockout (CRISPR KO) plasmids. This led to two different dot plot representations (HDR/ CRISPR Control and HDR/ CRISPR KO), where fluorescence intensity corresponding to stomatin expression was plotted on the x-axis and Forward Scatter (FSC) on the y-axis. (B) Flow cytometry profiles of K562 stomatin-negative clones (C2, C9, E3 D8, and G8) compared to stomatin-positive controls (WT) and controls incubated without the primary anti-stomatin antibody (negative). (C) MFI averages of stomatin-negative (stom−) and stomatin-positive (stom+) K562 clones. A comparison of their stomatin expression level was performed using an unpaired t-test. (p values ≤ 0.0001: ****).

