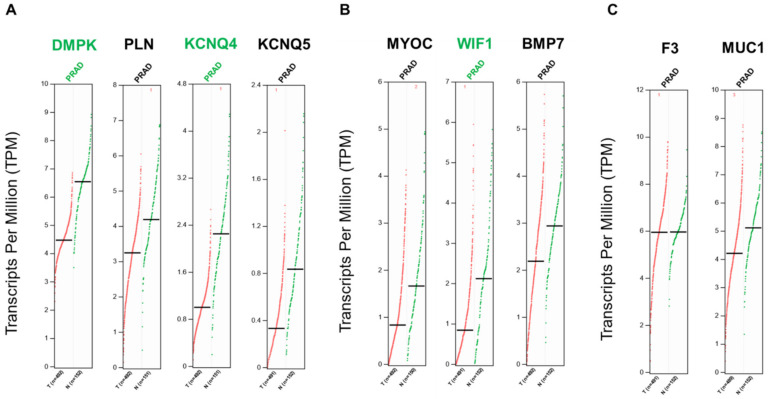
Figure 6.
Differential gene expressions of transcripts translated into the membrane and secreted proteins in prostate cancer. (A)—Genes from downregulated membrane proteins. (B)—Genes from downregulated secreted proteins. (C)—Genes from upregulated proteins are commonly present in secreted and membrane proteins. Differential expression levels were calculated using the web based GEPIA tool [40]. GEPIA analysis revealed that genes of the proteins identified were negatively regulated in PRAD. Genes were considered positively or negatively regulated written in red and green, respectively, in PRAD (n = 489–492) relative to normal tissue (n = 150–152) when absolute values of fold-change were >1.0 and the q-value < 0.01 (ANOVA). Red dots: indicate prostate cancer tumor samples; green dots: indicate normal prostate samples.

