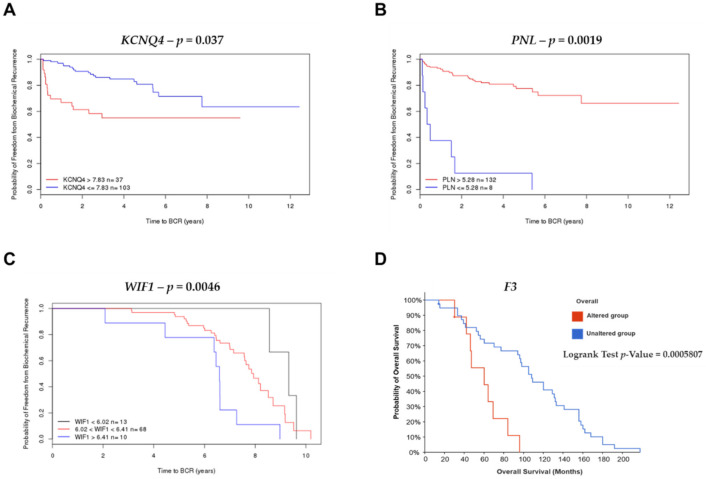
Figure 7.
Kaplan–Meier curves displaying the probability of freedom from BRC and overall survival of PCa with (red) or without (blue) Differentially Expressed Genes (DEGs) overexpression. Analyzed by the Cambridge Carcinoma of the Prostate App (CamcAPP) (https://bioinformatics.cruk.cam.ac.uk/apps/camcAPP/) [41] (accessed on 21 December 2021) and the cBioPortal for Cancer Genomics database (https://www.cbioportal.org/) (accessed on 21 December 2021) [42,43] from an integrative study. (A)—Kaplan–Meier curve with the probability of freedom from biochemical recurrence of PCa with (red) or without (blue) KCNQ4 overexpression with cut-off = 7.83 from the MSKCC study [8]; the difference was statistically significant, p = 0.037. (B)—Kaplan–Meier curve with the probability of freedom from biochemical recurrence of PCa with (red) or without (blue) PLN overexpression with cut-off = 5.28 from the MSKCC study [8]; the difference was statistically significant, p = 0.0019. (C)—Kaplan–Meier curve with the probability of freedom from biochemical recurrence of PCa with WIF1 expression with cut-off <6.02 (black line), WIF1 gene expression with cut-off <6.41 (red line), and patients with WIF1 gene expression with cut-off >6.41 (blue line) (p = 0.0046) from the Stockholm study [44]; the difference was statistically significant, p = 0.0046. (D)—Kaplan–Meier curve with the probability of overall survival of PCa patients with (red) or without (blue) F3 alteration from the metastatic prostate adenocarcinoma (MCTP, Nature 2012) study [45]; the difference was statistically significant, p = 0.0005807.

