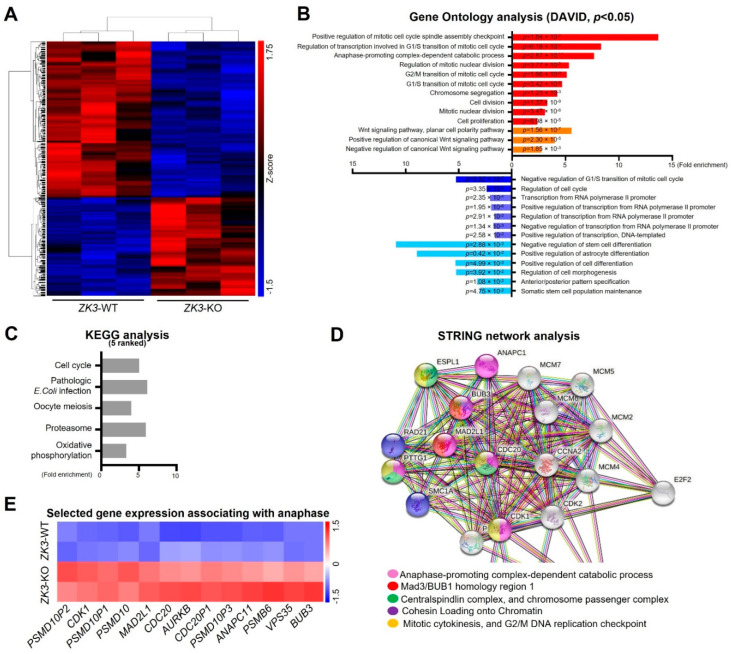
Figure 1.
Transcriptome analysis of ZK3-KO cells versus reference cells. (A) Hierarchical clustering heat-map for DEGs of the ZK3-KO HCT116 and parental HCT116 cells. (B) GO analysis for biological processes. Red bars represent categories generated from upregulated genes, and blue bars are those from the downregulated genes. p-values are indicated. (C) Top 5 KEGG pathways in pathway enrichment analysis of the DEGs. (D) STRING network analysis of cell cycle-associated genes classified by GO analysis. (E) Heat-map plot comparing the transcription levels of genes involved in the regulation of anaphase, based on the RNA sequencing results. GO, gene ontology; DEGs, differentially expressed genes; KEGG, Kyoto Encyclopedia of Genes and Genomes.

