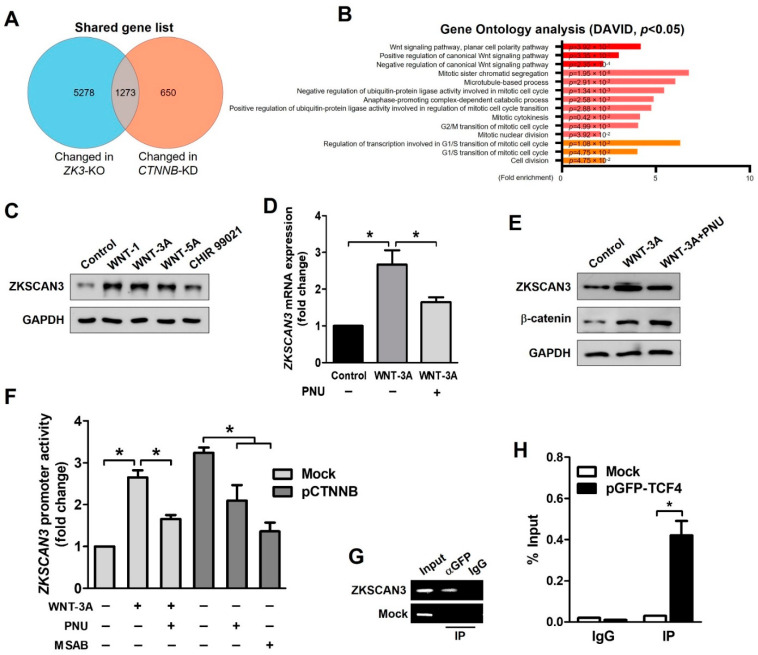
Figure 3.
WNT signals upregulate ZKSCAN3 transcription through a β-catenin-dependent pathway. (A) Venn diagram comparing the DEGs of ZK3-KO cells with previously reported results using the CTNNB1-KD HCT116 cell line. (B) GO analysis using selected genes, which were altered in both the RNA sequencing results. p-values are indicated. (C) HCT116 cells were treated with WNT-1 (50 ng/mL), WNT-3A (100 ng/mL), WNT-5A (50 ng/mL), or CHIR 99,021 (3 μM) for 24 h, and cell lysates were subjected to Western blotting using the indicated antibodies. (D, E) HCT116 cells were treated with WNT-3A (100 ng/mL) for 24 h in the presence or absence of 40 μM PNU and cells were harvested. Extracted mRNA and cell lysates were subjected to qPCR against ZKSCAN3 (D) or Western blotting using the indicated antibodies (E), respectively. The qPCR data obtained in triplicate are indicated as fold changes of the ZKSCAN3 mRNA levels relative to that in the untreated control cells. Statistical significance was determined using the Kruskal–Wallis test (* p < 0.05). (F) Cells were transfected with both pGL-ZK3 and pCTNNB1 or empty vector for 24 h, followed by WNT-3A (100 ng/mL) treatment with or without PNU (40 μM) or MSAB (10 μM) for 24 h. The luciferase activity was determined, as described above. Data are expressed as fold change over that in the control cells; they were obtained from three independent experiments and are shown as means ± SD. Statistical significance was determined using the Kruskal–Wallis test (* p < 0.05). (G) ChIP of transfected cells. Cells were transfected with the pGFP-TCF4 vector. ChIP was performed using an anti-GFP antibody or IgG, followed by PCR amplification of the ZKSCAN3 promoter. (H) ChIP-qPCR assay in transfected cells. Data are represented as means ± SD of triplicate measurements. Statistical significance was determined using the Wilcoxon test (* p < 0.05).

