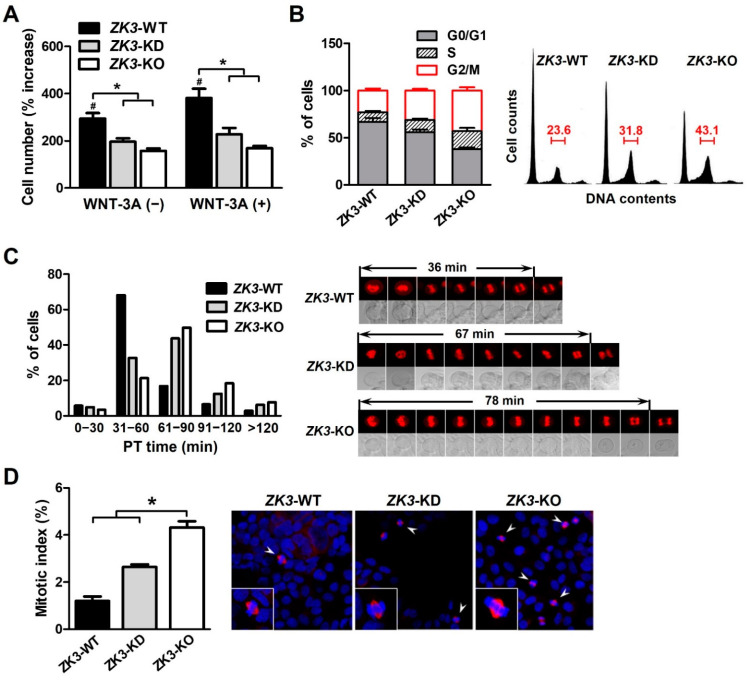
Figure 4.
ZKSCAN3 deficiency delays the progression of mitosis. (A) Cell proliferation rate was determined in the presence or absence of WNT-3A through sequential monitoring with Incucyte. The cell count data were acquired 6 days after initial seeding. Data are expressed as mean ± SDs (*, # p < 0.05). (B) Cell cycle profiles were determined using flow cytometry after staining with propidium iodide. Histogram data were obtained from three independent experiments and are expressed as mean ± SDs. Representative flow cytometric results are shown in the right panel. (C) Time-lapse analysis of ZK3-WT, ZK3-KD, and ZK3-KO cells. Cells stably expressing histone 2B-RFP were cultured on a live cell chamber instrument and continuous fluorescent images were taken. The graph presents the percentage of cells at different time points in the time taken from prometaphase to telophase (PT time). A minimum of 50 cells per sample was observed. Representative images with mean PT times are shown in the right panel. (D) Mitotic indices were determined by counting cells, which had pairs of duplicated chromatids aligned to the center of the dividing cell (arrowhead). Unsynchronized ZK3-WT, ZK3-KD, and ZK3-KO cells were immunostained with anti-α-tubulin antibody, and nuclei were stained with DAPI. Individual cells are magnified in the box. A minimum of 200 cells were counted on three slides. The histogram displays the mean ± SD of triplicate measurements (left panel). Representative images are shown in the right panel. Statistical significance was determined using the Kruskal–Wallis test (* p < 0.01).

