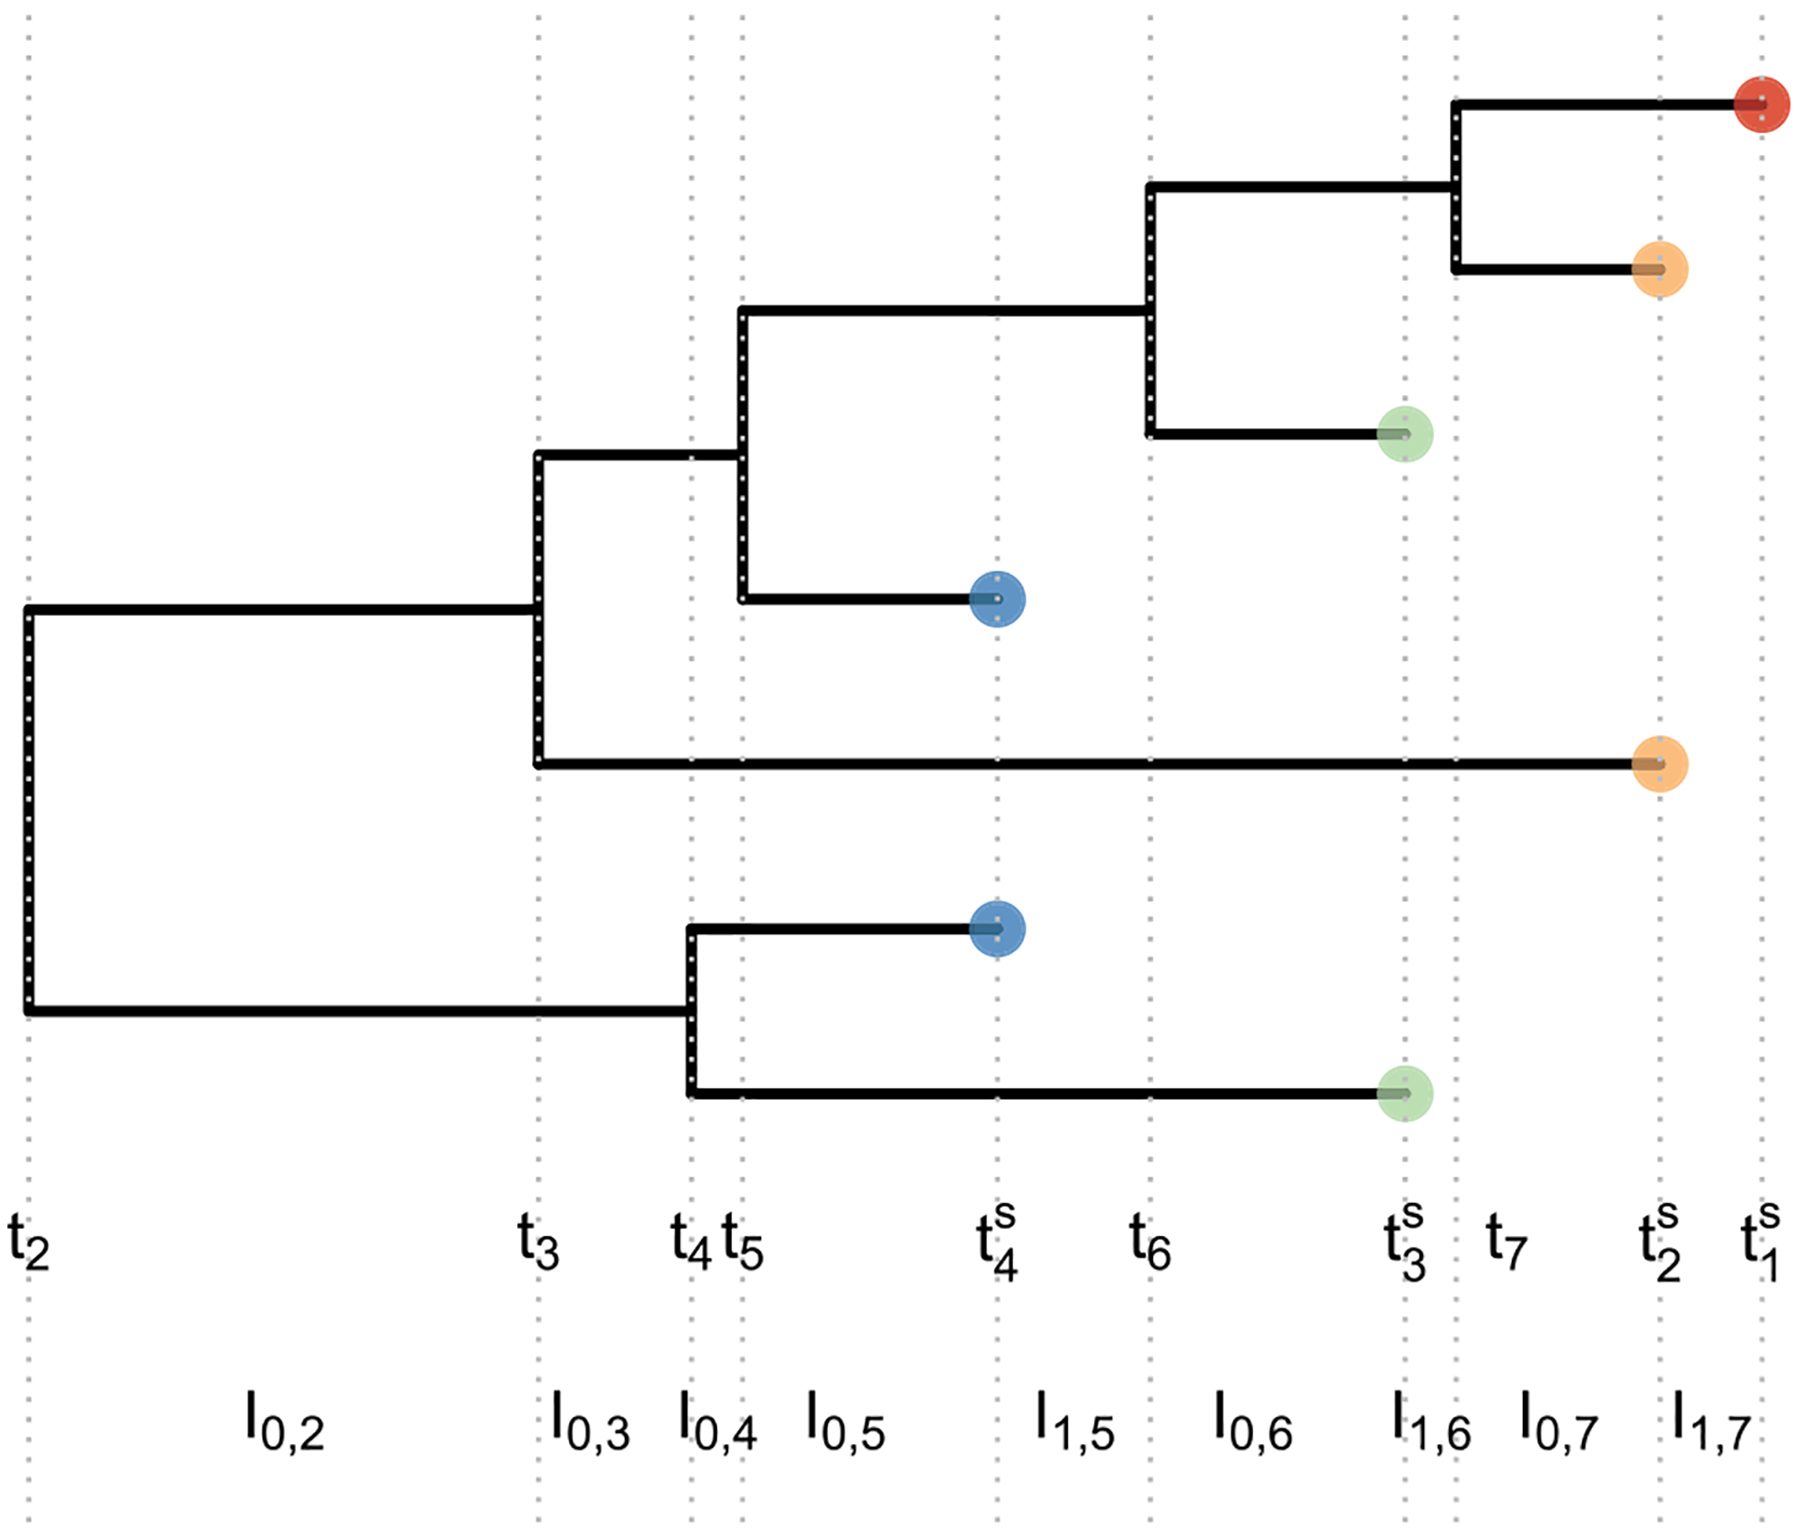
Figure 1.

Example of a heterochronous genealogy. A genealogy of 7 individuals sampled at 4 different times (color of tips) with multiplicities (n1 = 1, n2 = 2, n3 = 2, n4 = 2). Sampling times are denoted by , coalescent times are denoted by (tk)2:7 and Ii,j denoted the interval lengths delimited by coalescent times and/or sampling times, that is, every time there is a change in the number of lineages.
