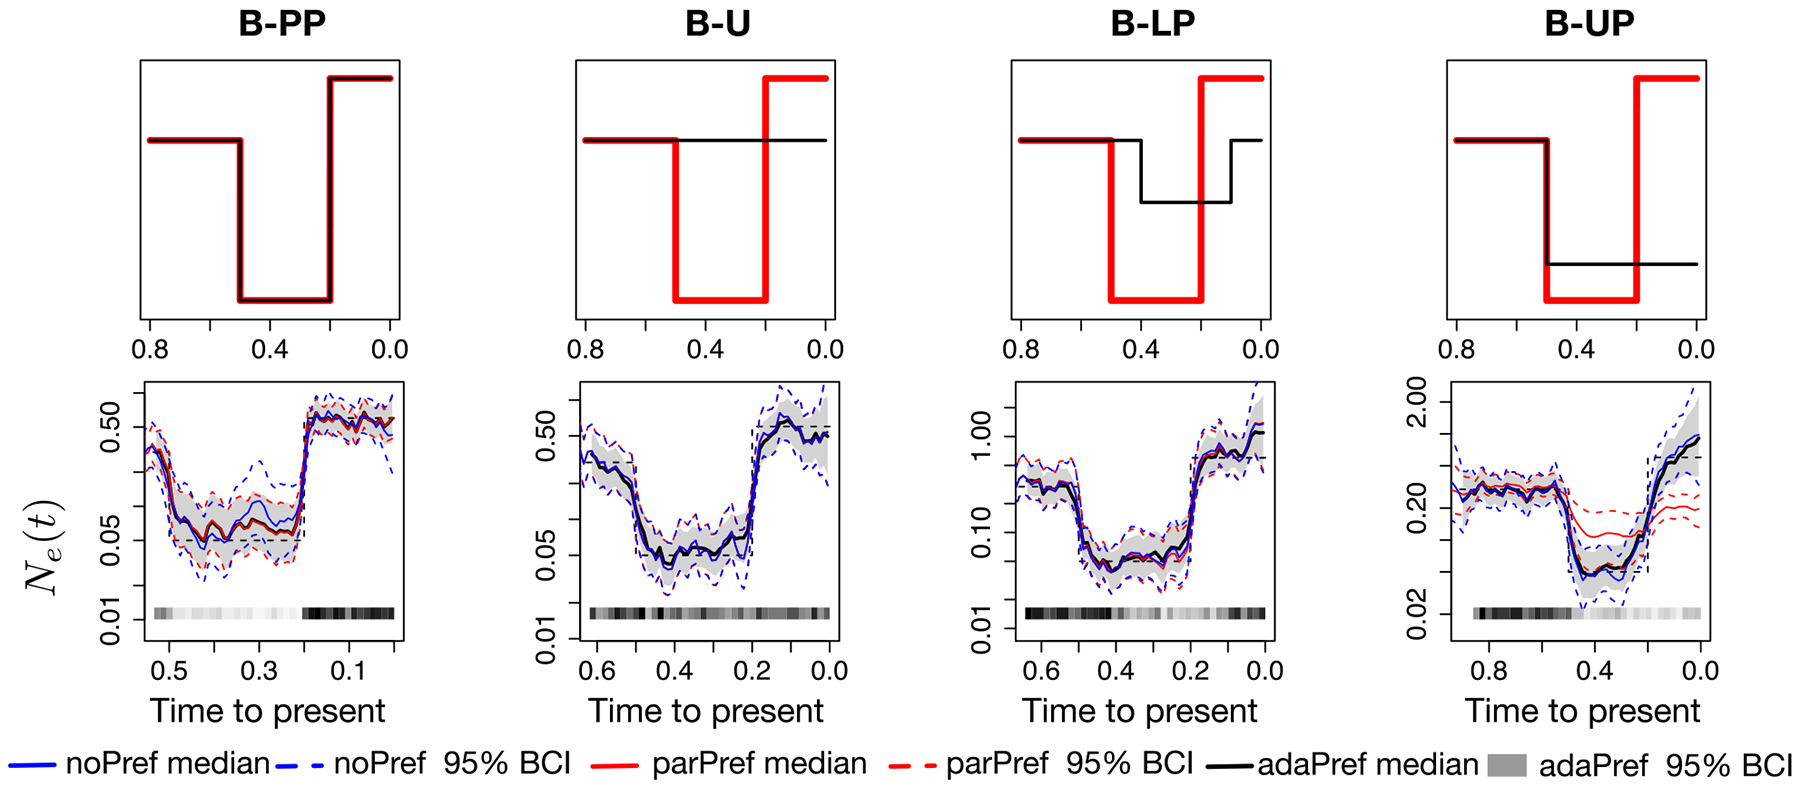
Figure 3.

Simulations from bottleneck trajectories and posterior inferences of Ne(t). First row panels depict the simulated log-effective population size (red) and log-sampling intensity (black) trajectories (up to a constant). Second row panels depict posterior estimates for the four simulation scenarios and from a single simulated genealogy picked at random with n = 500 tips. All models used GMRF of order 1 priors and posterior inference is approximated with INLA. The posterior medians of adaPref are depicted as solid black curves and the 95% Bayesian credible regions are depicted by shaded areas. Posterior medians of parPref and noPref are depicted respectively as solid blue and red curves, and the 95% Bayesian credible regions are depicted by the corresponding dashed curves. n and s are depicted by the heat maps at the bottom of the last four panels: the squares along the time axis depict the sampling times, while the intensity of the black color depicts the number of samples. The true trajectories are depicted as a black dashed curves.
