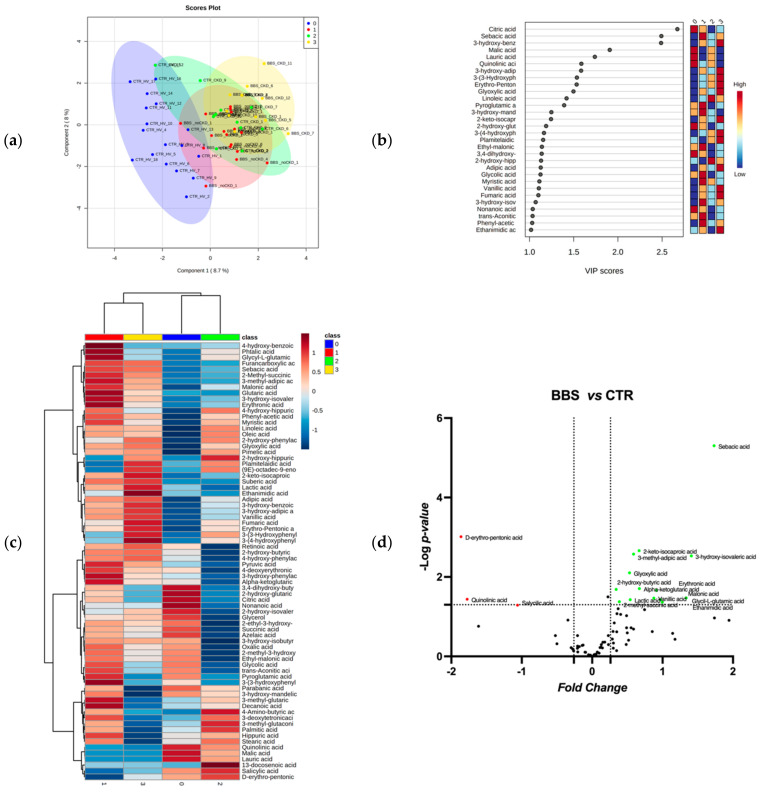
Figure 1.
Descriptive discriminant analysis of the urine metabolome of BBS patients. (a) The supervised partial least squares-discriminant analysis (PLS-DA) shows the segregation in four-condition analyzed metabolomes, CTR_HV, BBS_noCKD, CTR_CKD, and BBS_CKD, according to component 1, 8.7%, and component 2, 8.0%. (b) Discriminant features were identified according to the Variable Importance in Projection (VIP) score. The 30 most important molecules with VIP score values >1.0 are reported. The intensity of the colored boxes represents the relative abundance in each group. The concentrations of the identified metabolites were normalized, log (10) transformed, and Pareto scaled. (c) Heatmaps of the average urine metabolite concentrations (μM) in each group (0 = CTR_HV, 1 = BBS_noCKD, 2 = CTR_CKD, and 3 = BBS_CKD). The hits were ranked by ANOVA. (d) Volcano plot analysis of metabolites significantly different in BBS patients versus controls (BBS, including BBS_noCKD and BBS_CKD, versus CTR, including CTR_HV and CTR_CKD). The relative abundance of each metabolite was plotted against its statistical significance, respectively, reported as Fold Change (log2 fold change) and -log10 (p-value). Red and green dots indicate features that presented a p-value < 0.05 and a Fold Change < −1.3 or >1.3, respectively. Black dots refer to all the metabolites identified in the dataset whose relative abundance is not significantly different between BBS patients and healthy controls.

