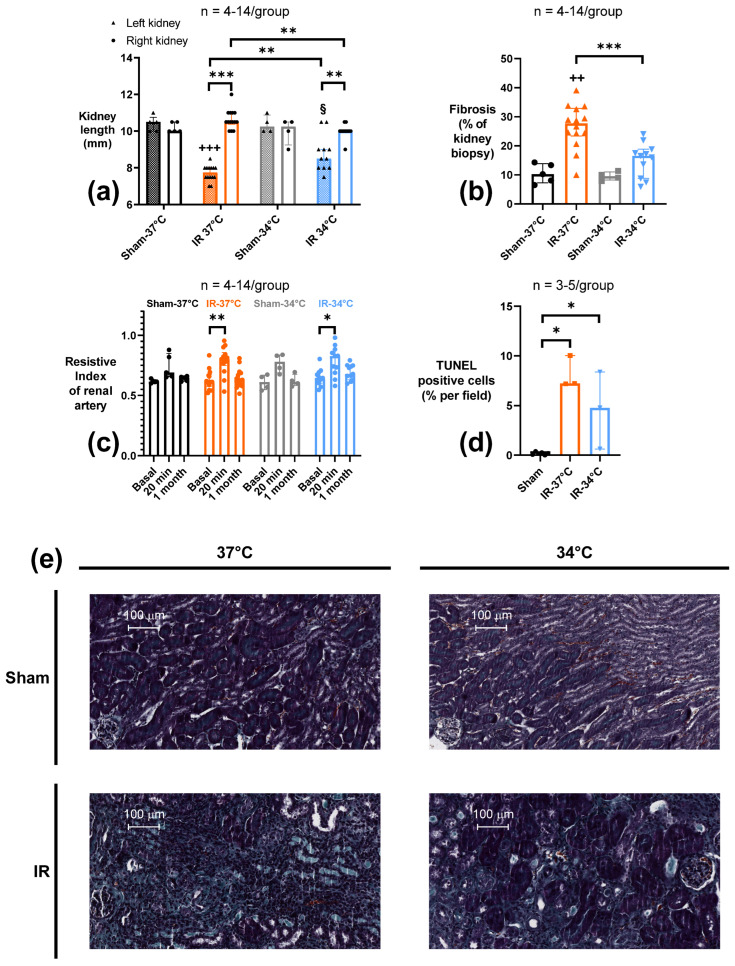
Figure 2.
Renal functional parameters measured after 15 min of unilateral renal ischemia where the mice body temperature was maintained at normothermia (IR-37 °C) or at mild therapeutic hypothermia (mTH) (IR-34 °C) followed by 1 month of reperfusion, or after a Sham procedure with the same body temperature (Sham-37 °C and Sham-34 °C). (a) Kidney length (long axis) was measured ex vivo to assess renal size modification in the ischemic kidney and the contralateral one. Ischemia-reperfusion induced renal atrophy of the ischemic kidney in both IR-groups, but ischemic kidneys remained bigger. (b) Histology with Masson’s trichrome staining was used to quantify chronic renal fibrosis, through a computerized automatic quantification of fibrosis based on the ratio between green pixels (representing fibrosis) and all the pixels representing the kidney biopsy, and expressed as a percentage. Ischemia-reperfusion led to the development or extensive renal fibrosis, but mTH significantly alleviated it. (c) Renal vascular resistance was evaluated by the Resistive Index measured in the renal artery with pulse-wave Doppler ultrasound. Three measures were performed on the ischemic kidney, at baseline (7 days before surgery), and 20 min, and 1 month after reperfusion. Ischemia-reperfusion was associated with a rise in renal vascular resistance as soon as 20 min after reperfusion in both IR-37 °C and IR-34 °C groups compared to their own baseline values, but there was no observable difference after 1 month of reperfusion. (d) Renal tissue apoptosis assessed with TUNEL-staining after 15 minutes of unilateral renal ischemia where the mice body temperature was maintained at normothermia (IR-37 °C) or at mild therapeutic hypothermia (mTH) (IR-34 °C), followed by 1 month of reperfusion, or after sham procedure (Sham-37 °C and Sham-34 °C pooled as Sham). Renal ischemia-reperfusion induced a significant increase of cell apoptosis whatever the temperature used during ischemia. (e) Representative images of 4-μm sections of kidney biopsy for each group, stained with Masson’s trichrome, with collagen fibers, i.e., mostly fibrosis, stained in green. Data are shown as median with interquartiles. * p < 0.05, ** p < 0.01, *** p < 0.001, Mann–Whitney test or Wilcoxon test if appropriate. ++ p < 0.01, +++ p < 0.001 vs. Sham-37 °C, Mann–Whitney test. § p < 0.05 vs. Sham-34 °C, Mann–Whitney test.

