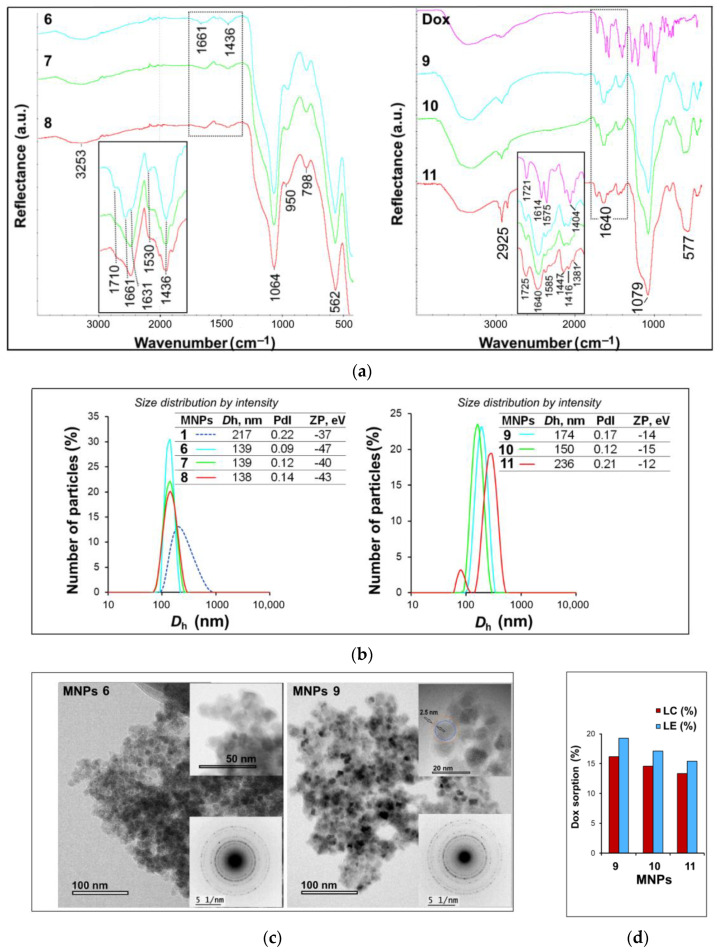
Figure 2.
(a) FTIR spectra of MNPs 6–11 (in inset, a magnified fragment of the spectrum in the region of 1400–1800 cm−1). (b) DLS data for MNPs 6–11. (c) TEM images of MNPs 6 and 9 (insets, magnified fragments of the TEM images and electron diffraction patterns). (d) Dox loading capacity (LC) and loading efficiency (LE) for MNPs 9–11.

