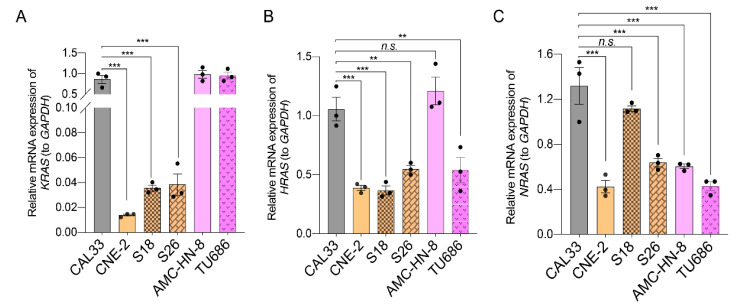
Figure 6.
Expression of RAS family genes in HNSCC cells. (A–C) A quantification polymerase chain reaction (qPCR) was used to quantify the expression of KRAS (A), HRAS (B), and NRAS (C). The reference genes used were GAPDH. The mean ± SEM of three independent experiments are shown. A one-way ANOVA, followed by a Dunnett’s multiple comparisons test, was used for statistical analysis. ** p < 0.01; *** p < 0.001; n.s.: not significant. Black dots represent number of experiments.

