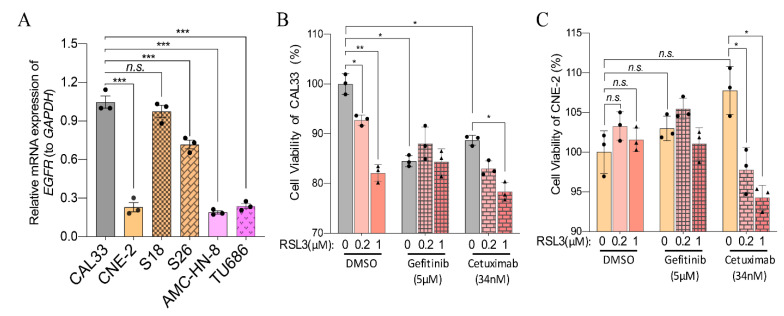
Figure 9.
The combination of ferroptosis-inducers and EGFR inhibitors reduces the sensitivity to ferroptosis-inducers. (A) Relative expression of EGFR in different HNSCC cells. The reference genes used were GAPDH. The mean ± SEM of three independent experiments are shown3. A one-way ANOVA, followed by a Dunnett’s multiple comparisons test, was used for statistical analysis (n.s.: not significant; *** p < 0.001). (B,C) The viability of CAL33 (B) and CNE-2 (C) at 24 h after treatment with the indicated concentrations of ferroptosis-inducers and EGFR inhibitors. The data were obtained from three independent experiments. Mean ± SEM is indicated. A two-way ANOVA, followed by an uncorrected Fisher’s LSD test, was used for statistical analysis. * p < 0.05; ** p < 0.01; *** p < 0.001; n.s.: not significant. Black dots or triangles represent number of experiments.

